Basic Stats
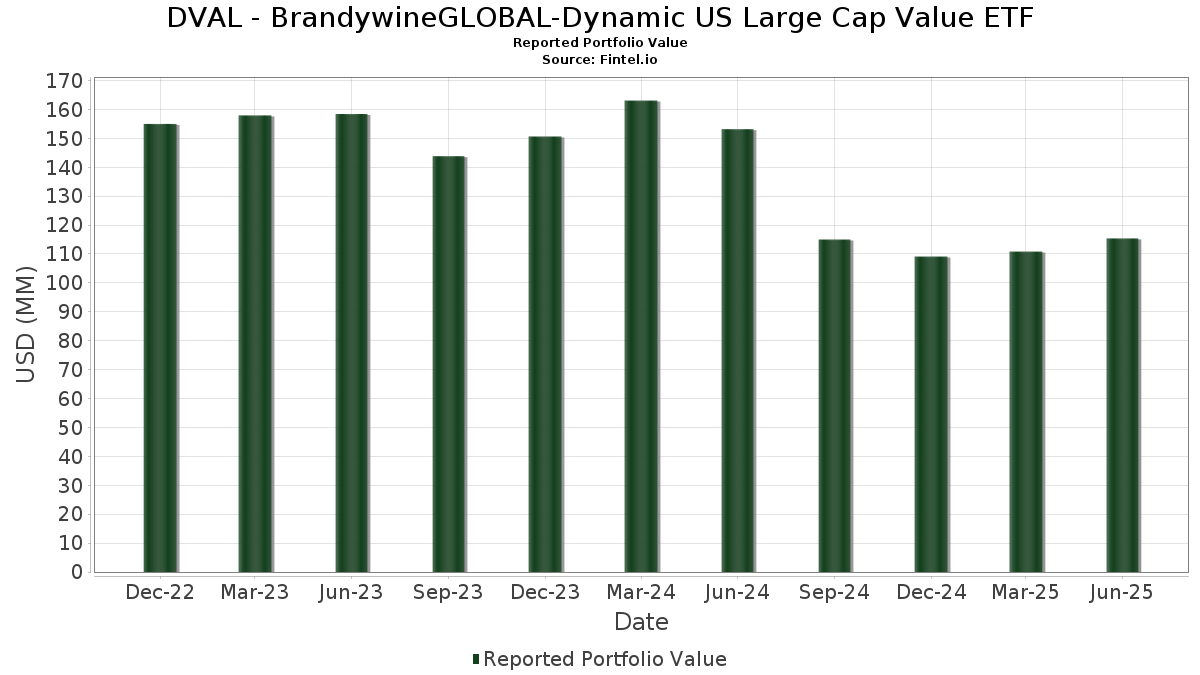
| Portfolio Value | $ 115,369,141 |
| Current Positions | 117 |
Latest Holdings, Performance, AUM (from 13F, 13D)
DVAL - BrandywineGLOBAL-Dynamic US Large Cap Value ETF has disclosed 117 total holdings in their latest SEC filings. Most recent portfolio value is calculated to be $ 115,369,141 USD. Actual Assets Under Management (AUM) is this value plus cash (which is not disclosed). DVAL - BrandywineGLOBAL-Dynamic US Large Cap Value ETF’s top holdings are International Business Machines Corporation (US:IBM) , Deere & Company (US:DE) , Caterpillar Inc. (US:CAT) , Comcast Corporation (US:CMCSA) , and Lockheed Martin Corporation (US:LMT) . DVAL - BrandywineGLOBAL-Dynamic US Large Cap Value ETF’s new positions include Air Products and Chemicals, Inc. (US:APD) , Las Vegas Sands Corp. (US:LVS) , PPG Industries, Inc. (US:PPG) , Schlumberger Limited (US:SLB) , and Northern Trust Corporation (US:NTRS) .
Top Increases This Quarter
We use the change in the portfolio allocation because this is the most meaningful metric. Changes can be due to trades or changes in share prices.
| Security | Shares (MM) |
Value (MM$) |
Portfolio % | ΔPortfolio % |
|---|---|---|---|---|
| 0.02 | 1.36 | 1.1748 | 1.1748 | |
| 0.02 | 2.84 | 2.4621 | 1.0970 | |
| 0.05 | 3.78 | 3.2763 | 1.0446 | |
| 0.03 | 2.03 | 1.7571 | 1.0408 | |
| 0.01 | 1.11 | 0.9604 | 0.8589 | |
| 0.03 | 2.19 | 1.8934 | 0.7972 | |
| 0.00 | 0.87 | 0.7500 | 0.7500 | |
| 0.02 | 0.81 | 0.6978 | 0.6978 | |
| 0.00 | 0.76 | 0.6569 | 0.6569 | |
| 0.01 | 5.08 | 4.4027 | 0.6115 |
Top Decreases This Quarter
We use the change in the portfolio allocation because this is the most meaningful metric. Changes can be due to trades or changes in share prices.
| Security | Shares (MM) |
Value (MM$) |
Portfolio % | ΔPortfolio % |
|---|---|---|---|---|
| 0.02 | 0.50 | 0.4363 | -3.8174 | |
| 0.00 | 0.28 | 0.2430 | -1.0699 | |
| 0.05 | 0.05 | 0.0430 | -0.9816 | |
| 0.00 | 0.17 | 0.1480 | -0.7599 | |
| 0.02 | 4.32 | 3.7467 | -0.6516 | |
| 0.01 | 0.37 | 0.3245 | -0.6307 | |
| 0.00 | 0.03 | 0.0295 | -0.5767 | |
| 0.01 | 1.77 | 1.5299 | -0.2121 | |
| 0.01 | 0.64 | 0.5512 | -0.2105 | |
| 0.06 | 2.45 | 2.1266 | -0.2011 |
13F and Fund Filings
This form was filed on 2025-08-26 for the reporting period 2025-06-30. Click the link icon to see the full transaction history.
Upgrade to unlock premium data and export to Excel ![]() .
.
| Security | Type | Avg Share Price | Shares (MM) |
ΔShares (%) |
ΔShares (%) |
Value ($MM) |
Portfolio (%) |
ΔPortfolio (%) |
|
|---|---|---|---|---|---|---|---|---|---|
| IBM / International Business Machines Corporation | 0.02 | -1.99 | 6.17 | 16.19 | 5.3492 | 0.5560 | |||
| DE / Deere & Company | 0.01 | -7.36 | 5.32 | 0.38 | 4.6099 | -0.1720 | |||
| CAT / Caterpillar Inc. | 0.01 | 2.72 | 5.08 | 20.92 | 4.4027 | 0.6115 | |||
| CMCSA / Comcast Corporation | 0.14 | 9.98 | 4.85 | 6.38 | 4.2050 | 0.0895 | |||
| LMT / Lockheed Martin Corporation | 0.01 | 0.50 | 4.85 | 4.19 | 4.1987 | 0.0034 | |||
| TMUS / T-Mobile US, Inc. | 0.02 | -0.72 | 4.32 | -11.30 | 3.7467 | -0.6516 | |||
| HON / Honeywell International Inc. | 0.02 | -0.74 | 4.13 | 9.17 | 3.5812 | 0.1658 | |||
| PYPL / PayPal Holdings, Inc. | 0.05 | 34.19 | 3.78 | 52.89 | 3.2763 | 1.0446 | |||
| GM / General Motors Company | 0.07 | 2.61 | 3.46 | 7.36 | 2.9938 | 0.0908 | |||
| MMM / 3M Company | 0.02 | 1.86 | 3.12 | 5.58 | 2.7040 | 0.0378 | |||
| PEP / PepsiCo, Inc. | 0.02 | 113.24 | 2.84 | 87.77 | 2.4621 | 1.0970 | |||
| VZ / Verizon Communications Inc. | 0.06 | -0.29 | 2.45 | -4.88 | 2.1266 | -0.2011 | |||
| EOG / EOG Resources, Inc. | 0.02 | 47.93 | 2.36 | 37.99 | 2.0465 | 0.5023 | |||
| WFC / Wells Fargo & Company | 0.03 | 61.14 | 2.19 | 79.84 | 1.8934 | 0.7972 | |||
| MET / MetLife, Inc. | 0.03 | 154.97 | 2.03 | 155.29 | 1.7571 | 1.0408 | |||
| EBAY / eBay Inc. | 0.03 | 26.02 | 1.91 | 38.61 | 1.6550 | 0.4113 | |||
| WMT / Walmart Inc. | 0.02 | -0.74 | 1.83 | 10.57 | 1.5873 | 0.0926 | |||
| WMB / The Williams Companies, Inc. | 0.03 | -0.42 | 1.81 | 4.64 | 1.5644 | 0.0083 | |||
| JNJ / Johnson & Johnson | 0.01 | -0.73 | 1.77 | -8.60 | 1.5299 | -0.2121 | |||
| JBL / Jabil Inc. | 0.01 | -0.74 | 1.73 | 59.10 | 1.4999 | 0.5184 | |||
| NRG / NRG Energy, Inc. | 0.01 | -0.56 | 1.65 | 67.24 | 1.4291 | 0.5396 | |||
| SYY / Sysco Corporation | 0.02 | 69.14 | 1.64 | 70.66 | 1.4216 | 0.5546 | |||
| GIS / General Mills, Inc. | 0.03 | 26.27 | 1.57 | 9.41 | 1.3595 | 0.0659 | |||
| KR / The Kroger Co. | 0.02 | 1.36 | 1.1748 | 1.1748 | |||||
| UPS / United Parcel Service, Inc. | 0.01 | 14.33 | 1.29 | 4.96 | 1.1177 | 0.0086 | |||
| GVMXX / State Street Institutional Investment Trust - State Street Institutional US Govt Money Market Fnd Premier Cls | 1.18 | 27.77 | 1.18 | 27.78 | 1.0247 | 0.1897 | |||
| DHI / D.R. Horton, Inc. | 0.01 | 871.53 | 1.11 | 889.29 | 0.9604 | 0.8589 | |||
| PHM / PulteGroup, Inc. | 0.01 | -0.73 | 1.07 | 1.91 | 0.9263 | -0.0207 | |||
| FDX / FedEx Corporation | 0.00 | 13.06 | 1.07 | 5.44 | 0.9241 | 0.0115 | |||
| CF / CF Industries Holdings, Inc. | 0.01 | 4.48 | 1.06 | 23.06 | 0.9207 | 0.1413 | |||
| NVR / NVR, Inc. | 0.00 | 27.93 | 1.05 | 30.35 | 0.9087 | 0.1833 | |||
| CSL / Carlisle Companies Incorporated | 0.00 | -0.79 | 1.03 | 8.85 | 0.8956 | 0.0386 | |||
| PG / The Procter & Gamble Company | 0.01 | -0.74 | 1.03 | -7.23 | 0.8901 | -0.1086 | |||
| AFL / Aflac Incorporated | 0.01 | 15.17 | 0.96 | 9.30 | 0.8354 | 0.0392 | |||
| FLEX / Flex Ltd. | 0.02 | 12.75 | 0.95 | 70.07 | 0.8226 | 0.3193 | |||
| APD / Air Products and Chemicals, Inc. | 0.00 | 0.87 | 0.7500 | 0.7500 | |||||
| AN / AutoNation, Inc. | 0.00 | -0.76 | 0.86 | 21.81 | 0.7456 | 0.1081 | |||
| MGM / MGM Resorts International | 0.02 | -0.74 | 0.81 | 15.14 | 0.6985 | 0.0670 | |||
| LVS / Las Vegas Sands Corp. | 0.02 | 0.81 | 0.6978 | 0.6978 | |||||
| KMB / Kimberly-Clark Corporation | 0.01 | 12.57 | 0.80 | 2.05 | 0.6894 | -0.0140 | |||
| ORI / Old Republic International Corporation | 0.02 | -0.60 | 0.77 | -2.53 | 0.6683 | -0.0459 | |||
| UNP / Union Pacific Corporation | 0.00 | 0.76 | 0.6569 | 0.6569 | |||||
| AMGN / Amgen Inc. | 0.00 | -0.72 | 0.73 | -11.08 | 0.6334 | -0.1078 | |||
| AMCR / Amcor plc | 0.08 | 93.01 | 0.73 | 82.91 | 0.6311 | 0.2718 | |||
| LEN / Lennar Corporation | 0.01 | -0.50 | 0.72 | -4.12 | 0.6253 | -0.0537 | |||
| MLM / Martin Marietta Materials, Inc. | 0.00 | -0.76 | 0.72 | 14.01 | 0.6207 | 0.0535 | |||
| HIG / The Hartford Insurance Group, Inc. | 0.01 | -0.56 | 0.67 | 1.97 | 0.5829 | -0.0123 | |||
| PPG / PPG Industries, Inc. | 0.01 | 0.67 | 0.5820 | 0.5820 | |||||
| IPG / The Interpublic Group of Companies, Inc. | 0.03 | -0.74 | 0.67 | -10.56 | 0.5803 | -0.0950 | |||
| DIS / The Walt Disney Company | 0.01 | -0.76 | 0.65 | 24.71 | 0.5643 | 0.0931 | |||
| BBY / Best Buy Co., Inc. | 0.01 | 61.80 | 0.65 | 47.72 | 0.5609 | 0.1651 | |||
| SLB / Schlumberger Limited | 0.02 | 0.64 | 0.5523 | 0.5523 | |||||
| BMY / Bristol-Myers Squibb Company | 0.01 | -0.73 | 0.64 | -24.64 | 0.5512 | -0.2105 | |||
| NTAP / NetApp, Inc. | 0.01 | 90.16 | 0.60 | 130.62 | 0.5158 | 0.2830 | |||
| MTG / MGIC Investment Corporation | 0.02 | -0.71 | 0.59 | 11.39 | 0.5094 | 0.0340 | |||
| RL / Ralph Lauren Corporation | 0.00 | -0.75 | 0.54 | 23.23 | 0.4691 | 0.0731 | |||
| TOL / Toll Brothers, Inc. | 0.00 | 21.05 | 0.53 | 30.85 | 0.4566 | 0.0933 | |||
| TPR / Tapestry, Inc. | 0.01 | 322.43 | 0.51 | 700.00 | 0.4442 | 0.3884 | |||
| CSX / CSX Corporation | 0.02 | -89.23 | 0.50 | -89.83 | 0.4363 | -3.8174 | |||
| AMG / Affiliated Managers Group, Inc. | 0.00 | -0.72 | 0.49 | 16.23 | 0.4221 | 0.0441 | |||
| WH / Wyndham Hotels & Resorts, Inc. | 0.01 | 0.56 | 0.48 | -9.94 | 0.4167 | -0.0641 | |||
| CMI / Cummins Inc. | 0.00 | 223.33 | 0.48 | 237.59 | 0.4129 | 0.2856 | |||
| 37C / CNH Industrial N.V. | 0.04 | 5.96 | 0.46 | 11.89 | 0.3997 | 0.0276 | |||
| FITB / Fifth Third Bancorp | 0.01 | 15.53 | 0.46 | 21.11 | 0.3985 | 0.0562 | |||
| AM / Antero Midstream Corporation | 0.02 | 11.33 | 0.45 | 17.19 | 0.3906 | 0.0436 | |||
| COKE / Coca-Cola Consolidated, Inc. | 0.00 | 1,208.64 | 0.44 | 8.13 | 0.3811 | 0.0145 | |||
| LDOS / Leidos Holdings, Inc. | 0.00 | 21.18 | 0.43 | 41.83 | 0.3762 | 0.0997 | |||
| PRI / Primerica, Inc. | 0.00 | 55.43 | 0.42 | 49.29 | 0.3630 | 0.1102 | |||
| INGR / Ingredion Incorporated | 0.00 | 54.71 | 0.41 | 55.34 | 0.3529 | 0.1161 | |||
| MUSA / Murphy USA Inc. | 0.00 | 15.30 | 0.40 | -0.25 | 0.3507 | -0.0150 | |||
| EMN / Eastman Chemical Company | 0.01 | 17.94 | 0.39 | 0.00 | 0.3381 | -0.0141 | |||
| SYF / Synchrony Financial | 0.01 | -87.52 | 0.37 | -72.78 | 0.3245 | -0.6307 | |||
| CNM / Core & Main, Inc. | 0.01 | -0.74 | 0.37 | 23.84 | 0.3245 | 0.0521 | |||
| TRGP / Targa Resources Corp. | 0.00 | -0.74 | 0.37 | -13.72 | 0.3217 | -0.0669 | |||
| RF / Regions Financial Corporation | 0.02 | 15.57 | 0.36 | 25.17 | 0.3109 | 0.0521 | |||
| TLN / Talen Energy Corporation | 0.00 | 87.92 | 0.36 | 174.62 | 0.3096 | 0.1918 | |||
| BYD / Boyd Gaming Corporation | 0.00 | 29.09 | 0.35 | 53.33 | 0.2993 | 0.0962 | |||
| NTRS / Northern Trust Corporation | 0.00 | 0.34 | 0.2950 | 0.2950 | |||||
| MRK / Merck & Co., Inc. | 0.00 | -0.76 | 0.33 | -12.43 | 0.2874 | -0.0545 | |||
| BLD / TopBuild Corp. | 0.00 | -0.32 | 0.30 | 5.94 | 0.2628 | 0.0042 | |||
| AOS / A. O. Smith Corporation | 0.00 | -0.68 | 0.30 | -0.34 | 0.2575 | -0.0116 | |||
| UHS / Universal Health Services, Inc. | 0.00 | -0.12 | 0.29 | -3.97 | 0.2521 | -0.0205 | |||
| SEIC / SEI Investments Company | 0.00 | 0.29 | 0.2520 | 0.2520 | |||||
| H / Hyatt Hotels Corporation | 0.00 | 12.72 | 0.29 | 28.44 | 0.2510 | 0.0476 | |||
| MDLZ / Mondelez International, Inc. | 0.00 | -17.10 | 0.28 | -20.06 | 0.2454 | 0.0311 | |||
| STLD / Steel Dynamics, Inc. | 0.00 | -81.17 | 0.28 | -80.76 | 0.2430 | -1.0699 | |||
| AFG / American Financial Group, Inc. | 0.00 | 82.93 | 0.28 | 75.95 | 0.2415 | 0.0985 | |||
| EIX / Edison International | 0.01 | 0.27 | 0.2382 | 0.2382 | |||||
| TRMB / Trimble Inc. | 0.00 | 0.27 | 0.2313 | 0.2313 | |||||
| GL / Globe Life Inc. | 0.00 | 39.12 | 0.27 | 31.68 | 0.2306 | 0.0477 | |||
| Aptiv PLC / EC (JE00BTDN8H13) | 0.00 | 0.26 | 0.2225 | 0.2225 | |||||
| ADT / ADT Inc. | 0.03 | 147.10 | 0.25 | 157.14 | 0.2186 | 0.1301 | |||
| JPM / JPMorgan Chase & Co. | 0.00 | -1.39 | 0.25 | 16.51 | 0.2143 | 0.0229 | |||
| ACM / AECOM | 0.00 | 17.67 | 0.23 | 43.40 | 0.1979 | 0.0540 | |||
| RPRX / Royalty Pharma plc | 0.01 | 0.22 | 0.1948 | 0.1948 | |||||
| CL / Colgate-Palmolive Company | 0.00 | 0.34 | 0.21 | -2.75 | 0.1845 | -0.0128 | |||
| NXST / Nexstar Media Group, Inc. | 0.00 | 156.81 | 0.19 | 149.35 | 0.1666 | 0.0966 | |||
| SCI / Service Corporation International | 0.00 | -83.31 | 0.17 | -83.07 | 0.1480 | -0.7599 | |||
| MAT / Mattel, Inc. | 0.01 | 0.17 | 0.1439 | 0.1439 | |||||
| RHI / Robert Half Inc. | 0.00 | -0.74 | 0.17 | -25.68 | 0.1437 | -0.0566 | |||
| FHN / First Horizon Corporation | 0.01 | 0.16 | 0.1384 | 0.1384 | |||||
| GPK / Graphic Packaging Holding Company | 0.01 | -0.73 | 0.16 | -19.07 | 0.1360 | -0.0398 | |||
| PPC / Pilgrim's Pride Corporation | 0.00 | 0.16 | 0.1359 | 0.1359 | |||||
| FLR / Fluor Corporation | 0.00 | 37.30 | 0.15 | 97.44 | 0.1338 | 0.0629 | |||
| XP / XP Inc. | 0.01 | 0.13 | 0.1098 | 0.1098 | |||||
| SLM / SLM Corporation | 0.00 | 0.10 | 0.0879 | 0.0879 | |||||
| ACT / Enact Holdings, Inc. | 0.00 | 14.34 | 0.09 | 22.08 | 0.0819 | 0.0121 | |||
| SNA / Snap-on Incorporated | 0.00 | 0.09 | 0.0766 | 0.0766 | |||||
| MTN / Vail Resorts, Inc. | 0.00 | 0.08 | 0.0694 | 0.0694 | |||||
| REYN / Reynolds Consumer Products Inc. | 0.00 | -0.06 | 0.07 | -10.84 | 0.0649 | -0.0104 | |||
| WCC / WESCO International, Inc. | 0.00 | 0.07 | 0.0618 | 0.0618 | |||||
| COLB / Columbia Banking System, Inc. | 0.00 | 0.07 | 0.0583 | 0.0583 | |||||
| R / Ryder System, Inc. | 0.00 | 0.05 | 0.0449 | 0.0449 | |||||
| GVMXX / State Street Institutional Investment Trust - State Street Institutional US Govt Money Market Fnd Premier Cls | 0.05 | -95.80 | 0.05 | -95.85 | 0.0430 | -0.9816 | |||
| FBIN / Fortune Brands Innovations, Inc. | 0.00 | -94.42 | 0.03 | -96.61 | 0.0295 | -0.5767 | |||
| CH1300646267 / Bunge Global SA | 0.00 | 2.88 | 0.03 | 6.90 | 0.0273 | 0.0010 | |||
| SAIC / Science Applications International Corporation | 0.00 | 0.03 | 0.0245 | 0.0245 |