Basic Stats
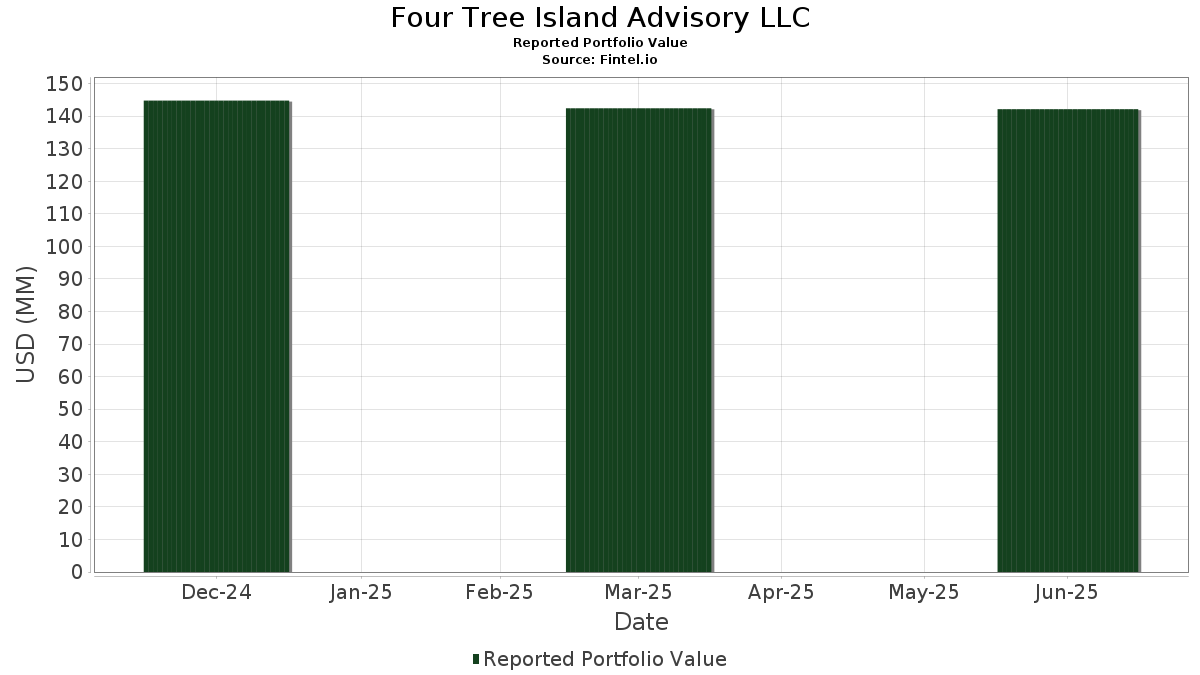
| Portfolio Value | $ 142,131,996 |
| Current Positions | 20 |
Latest Holdings, Performance, AUM (from 13F, 13D)
Four Tree Island Advisory LLC has disclosed 20 total holdings in their latest SEC filings. Most recent portfolio value is calculated to be $ 142,131,996 USD. Actual Assets Under Management (AUM) is this value plus cash (which is not disclosed). Four Tree Island Advisory LLC’s top holdings are Lam Research Corporation (US:LRCX) , Equitable Holdings, Inc. (US:EQH) , Jackson Financial Inc. (US:JXN) , Mueller Industries, Inc. (US:MLI) , and Willis Lease Finance Corporation (US:WLFC) .
Top Increases This Quarter
We use the change in the portfolio allocation because this is the most meaningful metric. Changes can be due to trades or changes in share prices.
| Security | Shares (MM) |
Value (MM$) |
Portfolio % | ΔPortfolio % |
|---|---|---|---|---|
| 0.23 | 22.83 | 16.0629 | 3.0263 | |
| 0.43 | 4.53 | 3.1906 | 0.9816 | |
| 0.05 | 9.96 | 7.0075 | 0.7491 | |
| 0.00 | 1.68 | 1.1808 | 0.6832 | |
| 0.10 | 11.61 | 8.1695 | 0.5478 | |
| 0.21 | 8.50 | 5.9776 | 0.3798 | |
| 0.06 | 2.18 | 1.5348 | 0.0825 | |
| 0.09 | 1.15 | 0.8115 | 0.0671 | |
| 0.01 | 0.65 | 0.4574 | 0.0524 | |
| 0.00 | 0.30 | 0.2114 | 0.0489 |
Top Decreases This Quarter
We use the change in the portfolio allocation because this is the most meaningful metric. Changes can be due to trades or changes in share prices.
| Security | Shares (MM) |
Value (MM$) |
Portfolio % | ΔPortfolio % |
|---|---|---|---|---|
| 0.03 | 2.19 | 1.5396 | -1.5941 | |
| 0.09 | 13.34 | 9.3857 | -1.3632 | |
| 0.36 | 20.30 | 14.2827 | -1.1335 | |
| 0.06 | 2.74 | 1.9258 | -0.9247 | |
| 0.22 | 17.85 | 12.5611 | -0.8964 | |
| 0.22 | 19.23 | 13.5281 | -0.1766 | |
| 0.15 | 1.51 | 1.0648 | -0.1258 | |
| 0.01 | 0.60 | 0.4212 | -0.1096 | |
| 0.01 | 0.32 | 0.2230 | -0.0476 | |
| 0.01 | 0.66 | 0.4639 | -0.0267 |
13F and Fund Filings
This form was filed on 2025-08-13 for the reporting period 2025-06-30. Click the link icon to see the full transaction history.
Upgrade to unlock premium data and export to Excel ![]() .
.
| Security | Type | Avg Share Price | Shares (MM) |
ΔShares (%) |
ΔShares (%) |
Value ($MM) |
Portfolio (%) |
ΔPortfolio (%) |
|
|---|---|---|---|---|---|---|---|---|---|
| LRCX / Lam Research Corporation | 0.23 | -8.15 | 22.83 | 22.97 | 16.0629 | 3.0263 | |||
| EQH / Equitable Holdings, Inc. | 0.36 | -14.14 | 20.30 | -7.53 | 14.2827 | -1.1335 | |||
| JXN / Jackson Financial Inc. | 0.22 | -7.04 | 19.23 | -1.48 | 13.5281 | -0.1766 | |||
| MLI / Mueller Industries, Inc. | 0.22 | -10.75 | 17.85 | -6.84 | 12.5611 | -0.8964 | |||
| WLFC / Willis Lease Finance Corporation | 0.09 | -3.58 | 13.34 | -12.85 | 9.3857 | -1.3632 | |||
| AER / AerCap Holdings N.V. | 0.10 | -6.58 | 11.61 | 6.98 | 8.1695 | 0.5478 | |||
| AMAT / Applied Materials, Inc. | 0.05 | -11.41 | 9.96 | 11.75 | 7.0075 | 0.7491 | |||
| AB / AllianceBernstein Holding L.P. - Limited Partnership | 0.21 | 0.00 | 8.50 | 6.59 | 5.9776 | 0.3798 | |||
| GTX / Garrett Motion Inc. | 0.43 | 14.80 | 4.53 | 44.17 | 3.1906 | 0.9816 | |||
| BMY / Bristol-Myers Squibb Company | 0.06 | -11.16 | 2.74 | -32.57 | 1.9258 | -0.9247 | |||
| VOYA / Voya Financial, Inc. | 0.03 | -53.20 | 2.19 | -50.96 | 1.5396 | -1.5941 | |||
| ITRN / Ituran Location and Control Ltd. | 0.06 | -1.52 | 2.18 | 5.46 | 1.5348 | 0.0825 | |||
| ABBV / AbbVie Inc. | 0.00 | -1.71 | 1.68 | 137.01 | 1.1808 | 0.6832 | |||
| STLA / Stellantis N.V. | 0.15 | -0.24 | 1.51 | -10.74 | 1.0648 | -0.1258 | |||
| PVBC / Provident Bancorp, Inc. | 0.09 | 0.00 | 1.15 | 8.77 | 0.8115 | 0.0671 | |||
| BHF / Brighthouse Financial, Inc. | 0.01 | 1.78 | 0.66 | -5.59 | 0.4639 | -0.0267 | |||
| NTR / Nutrien Ltd. | 0.01 | -3.87 | 0.65 | 12.85 | 0.4574 | 0.0524 | |||
| LYB / LyondellBasell Industries N.V. | 0.01 | -3.64 | 0.60 | -20.79 | 0.4212 | -0.1096 | |||
| DVN / Devon Energy Corporation | 0.01 | -3.29 | 0.32 | -17.92 | 0.2230 | -0.0476 | |||
| TT / Trane Technologies plc | 0.00 | 0.00 | 0.30 | 29.87 | 0.2114 | 0.0489 | |||
| TBNK / Territorial Bancorp Inc. | 0.00 | -100.00 | 0.00 | 0.0000 |