Basic Stats
| Insider Profile | Fondren Management LP |
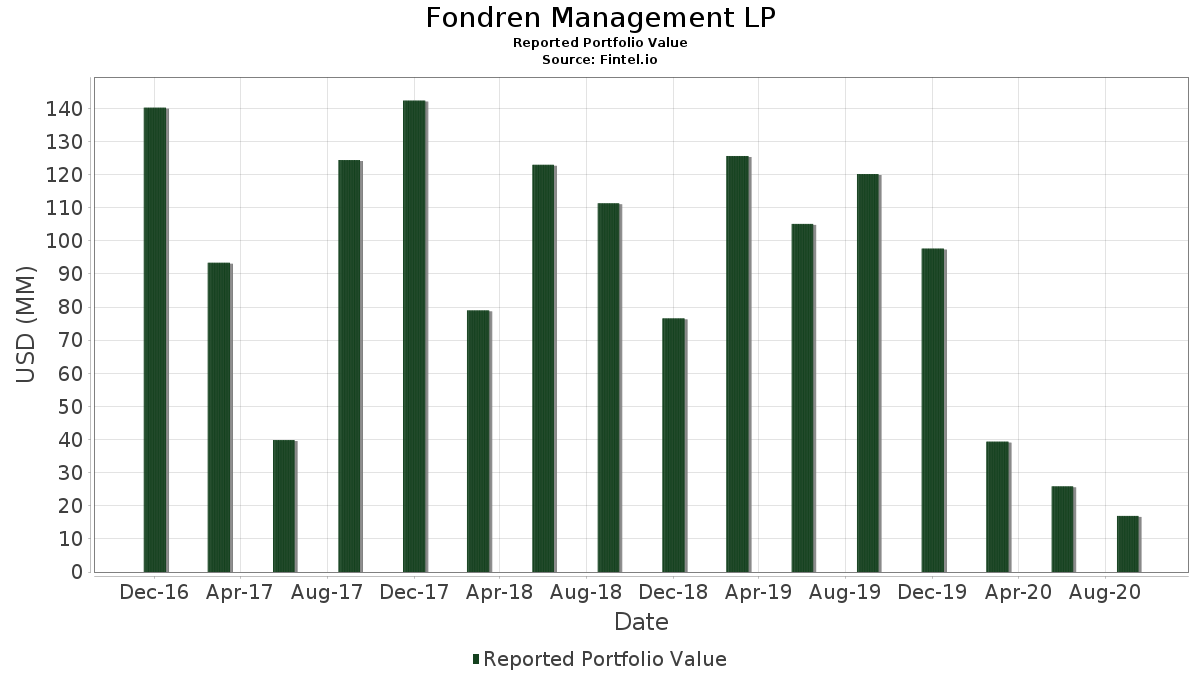
| Portfolio Value | $ 16,934,000 |
| Current Positions | 16 |
Latest Holdings, Performance, AUM (from 13F, 13D)
Fondren Management LP has disclosed 16 total holdings in their latest SEC filings. Most recent portfolio value is calculated to be $ 16,934,000 USD. Actual Assets Under Management (AUM) is this value plus cash (which is not disclosed). Fondren Management LP’s top holdings are Biglari Holdings Inc. (US:BH) , VAALCO Energy, Inc. (US:EGY) , Greenidge Generation Holdings Inc. (US:GREE) , Lesaka Technologies Inc (US:UEPS) , and Synacor Inc (US:US8715611062) .
Top Increases This Quarter
We use the change in the portfolio allocation because this is the most meaningful metric. Changes can be due to trades or changes in share prices.
| Security | Shares (MM) |
Value (MM$) |
Portfolio % | ΔPortfolio % |
|---|---|---|---|---|
| 0.65 | 2.17 | 12.8381 | 9.1348 | |
| 1.30 | 2.34 | 13.8361 | 6.7388 | |
| 0.04 | 3.94 | 23.2432 | 5.2641 | |
| 1.21 | 1.83 | 10.8185 | 3.0872 | |
| 2.47 | 2.47 | 14.5919 | 2.7477 | |
| 0.05 | 0.89 | 5.2675 | 2.3219 | |
| 0.04 | 0.54 | 3.1652 | 1.4953 | |
| 0.04 | 0.20 | 1.1929 | 1.1929 | |
| 0.10 | 0.25 | 1.4763 | 0.6568 | |
| 0.18 | 0.24 | 1.4055 | 0.6439 |
Top Decreases This Quarter
We use the change in the portfolio allocation because this is the most meaningful metric. Changes can be due to trades or changes in share prices.
| Security | Shares (MM) |
Value (MM$) |
Portfolio % | ΔPortfolio % |
|---|---|---|---|---|
| 0.00 | 0.00 | -13.1238 | ||
| 0.00 | 0.00 | -6.4092 | ||
| 0.00 | 0.00 | -2.3658 | ||
| 0.54 | 0.20 | 1.2047 | -2.1623 | |
| 0.00 | 0.00 | -1.6158 | ||
| 0.00 | 0.00 | -1.0862 | ||
| 0.00 | 0.00 | -0.9239 | ||
| 0.14 | 1.02 | 6.0529 | -0.4723 | |
| 0.00 | 0.00 | -0.3556 | ||
| 0.03 | 0.17 | 1.0216 | -0.3198 |
13F and Fund Filings
This form was filed on 2020-11-13 for the reporting period 2020-09-30. Click the link icon to see the full transaction history.
Upgrade to unlock premium data and export to Excel ![]() .
.
| Security | Type | Avg Share Price | Shares (MM) |
ΔShares (%) |
ΔShares (%) |
Value ($MM) |
Portfolio (%) |
ΔPortfolio (%) |
|
|---|---|---|---|---|---|---|---|---|---|
| BH / Biglari Holdings Inc. | 0.04 | -34.41 | 3.94 | -15.37 | 23.2432 | 5.2641 | |||
| EGY / VAALCO Energy, Inc. | 2.47 | 0.00 | 2.47 | -19.35 | 14.5919 | 2.7477 | |||
| GREE / Greenidge Generation Holdings Inc. | 1.30 | 0.00 | 2.34 | 27.61 | 13.8361 | 6.7388 | |||
| UEPS / Lesaka Technologies Inc | 0.65 | 104.76 | 2.17 | 126.93 | 12.8381 | 9.1348 | |||
| US8715611062 / Synacor Inc | 1.21 | -31.44 | 1.83 | -8.40 | 10.8185 | 3.0872 | |||
| OPNT / Opiant Pharmaceuticals Inc | 0.14 | -26.70 | 1.02 | -39.28 | 6.0529 | -0.4723 | |||
| US58503F5026 / Medley Capital Corp. | 0.05 | -94.98 | 0.89 | 17.06 | 5.2675 | 2.3219 | |||
| US05491N1046 / BBX Capital Corporation | 0.04 | -76.47 | 0.54 | 24.07 | 3.1652 | 1.4953 | |||
| CRD.B / Crawford & Company | 0.04 | -34.59 | 0.25 | -39.95 | 1.4822 | -0.1336 | |||
| US44244K1097 / Houston Wire & Cable Company | 0.10 | 11.11 | 0.25 | 17.92 | 1.4763 | 0.6568 | |||
| PTMN / BCP Investment Corp. | 0.18 | 0.00 | 0.24 | 20.81 | 1.4055 | 0.6439 | |||
| CRD.A / Crawford & Company | 0.04 | -16.80 | 0.23 | -31.16 | 1.3700 | 0.0673 | |||
| TGA / Transglobe Energy Corp. | 0.54 | -65.84 | 0.20 | -76.58 | 1.2047 | -2.1623 | |||
| SYNL / Synalloy Corp. | 0.04 | -18.76 | 0.20 | -40.06 | 1.1929 | 1.1929 | |||
| RMCF / Rocky Mountain Chocolate Factory, Inc. | 0.07 | -9.83 | 0.17 | -43.37 | 1.0334 | -0.1611 | |||
| USAP / Universal Stainless & Alloy Products, Inc. | 0.03 | -21.88 | 0.17 | -50.14 | 1.0216 | -0.3198 | |||
| HCHC / HC2 Holdings Inc | 0.00 | -100.00 | 0.00 | -100.00 | -1.6158 | ||||
| CSLT / Castlight Health Inc - Class B | 0.00 | -100.00 | 0.00 | 0.0000 | |||||
| HQI / HireQuest, Inc. | 0.00 | -100.00 | 0.00 | -100.00 | -1.0862 | ||||
| LUB / Luby`s, Inc. | 0.00 | -100.00 | 0.00 | -100.00 | -0.3556 | ||||
| ALOT / AstroNova, Inc. | 0.00 | -100.00 | 0.00 | -100.00 | -0.9239 | ||||
| HRTH / Harte-Hanks, Inc. | 0.00 | -100.00 | 0.00 | -100.00 | -6.4092 | ||||
| TTI / TETRA Technologies, Inc. | 0.00 | -100.00 | 0.00 | -100.00 | -2.3658 | ||||
| IMMR / Immersion Corporation | 0.00 | -100.00 | 0.00 | -100.00 | -13.1238 |