Basic Stats
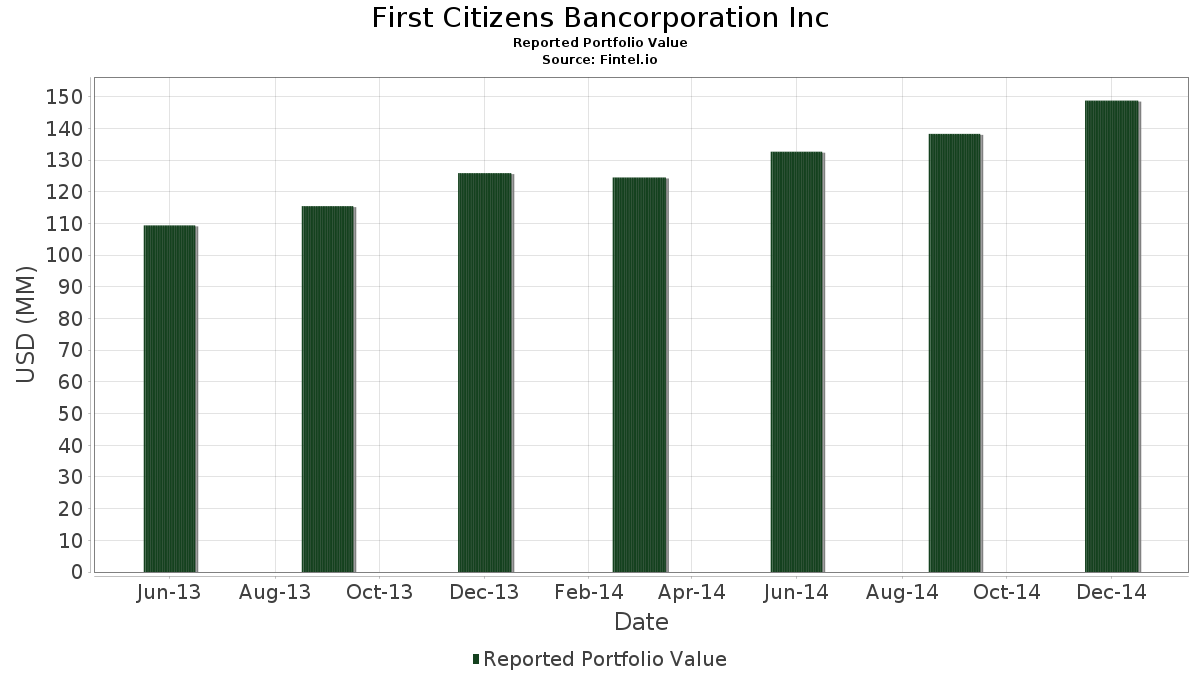
| Portfolio Value | $ 148,771,000 |
| Current Positions | 113 |
Latest Holdings, Performance, AUM (from 13F, 13D)
First Citizens Bancorporation Inc has disclosed 113 total holdings in their latest SEC filings. Most recent portfolio value is calculated to be $ 148,771,000 USD. Actual Assets Under Management (AUM) is this value plus cash (which is not disclosed). First Citizens Bancorporation Inc’s top holdings are Microsoft Corporation (US:MSFT) , AbbVie Inc. (US:ABBV) , iShares Trust - iShares MSCI EAFE ETF (US:EFA) , Chevron Corporation (US:CVX) , and Verizon Communications Inc. (US:VZ) . First Citizens Bancorporation Inc’s new positions include Union Pacific Corporation (US:UNP) , UGI Corporation (US:UGI) , Lam Research Corporation (US:LRCX) , Cummins Inc. (US:CMI) , and Schlumberger Limited (US:SLB) .
Top Increases This Quarter
We use the change in the portfolio allocation because this is the most meaningful metric. Changes can be due to trades or changes in share prices.
| Security | Shares (MM) |
Value (MM$) |
Portfolio % | ΔPortfolio % |
|---|---|---|---|---|
| 0.04 | 3.10 | 2.0858 | 0.4570 | |
| 0.07 | 2.97 | 1.9970 | 0.4348 | |
| 0.02 | 1.45 | 0.9713 | 0.2278 | |
| 0.02 | 1.84 | 1.2375 | 0.2010 | |
| 0.01 | 1.39 | 0.9316 | 0.1852 | |
| 0.04 | 1.22 | 0.8167 | 0.1773 | |
| 0.03 | 1.39 | 0.9336 | 0.1692 | |
| 0.03 | 1.26 | 0.8483 | 0.1605 | |
| 0.06 | 3.67 | 2.4669 | 0.1604 | |
| 0.06 | 2.22 | 1.4902 | 0.1486 |
Top Decreases This Quarter
We use the change in the portfolio allocation because this is the most meaningful metric. Changes can be due to trades or changes in share prices.
| Security | Shares (MM) |
Value (MM$) |
Portfolio % | ΔPortfolio % |
|---|---|---|---|---|
| 0.08 | 2.05 | 1.3800 | -1.0603 | |
| 0.01 | 1.46 | 0.9794 | -0.5814 | |
| 0.01 | 0.48 | 0.3260 | -0.4978 | |
| 0.00 | 0.26 | 0.1748 | -0.3836 | |
| 0.01 | 1.06 | 0.7159 | -0.3762 | |
| 0.00 | 0.00 | -0.3038 | ||
| 0.04 | 1.77 | 1.1871 | -0.2819 | |
| 0.02 | 0.77 | 0.5203 | -0.2529 | |
| 0.03 | 3.26 | 2.1893 | -0.2481 | |
| 0.07 | 2.44 | 1.6388 | -0.1896 |
13F and Fund Filings
This form was filed on 2015-01-21 for the reporting period 2014-12-31. Click the link icon to see the full transaction history.
Upgrade to unlock premium data and export to Excel ![]() .
.
| Security | Type | Avg Share Price | Shares (MM) |
ΔShares (%) |
ΔShares (%) |
Value ($MM) |
Portfolio (%) |
ΔPortfolio (%) |
|
|---|---|---|---|---|---|---|---|---|---|
| MSFT / Microsoft Corporation | 0.09 | 4.17 | 4.02 | 4.36 | 2.7042 | -0.0840 | |||
| ABBV / AbbVie Inc. | 0.06 | 1.60 | 3.67 | 15.08 | 2.4669 | 0.1604 | |||
| EFA / iShares Trust - iShares MSCI EAFE ETF | 0.06 | 7.51 | 3.61 | 2.04 | 2.4245 | -0.1322 | |||
| CVX / Chevron Corporation | 0.03 | 2.80 | 3.26 | -3.35 | 2.1893 | -0.2481 | |||
| VZ / Verizon Communications Inc. | 0.07 | 10.96 | 3.21 | 3.85 | 2.1590 | -0.0780 | |||
| IWM / iShares Trust - iShares Russell 2000 ETF | 0.03 | 2.03 | 3.15 | 11.61 | 2.1194 | 0.0762 | |||
| IWR / iShares Trust - iShares Russell Mid-Cap ETF | 0.02 | 3.68 | 3.13 | 9.41 | 2.1019 | 0.0348 | |||
| COP / ConocoPhillips | 0.04 | 52.67 | 3.10 | 37.79 | 2.0858 | 0.4570 | |||
| MCHP / Microchip Technology Incorporated | 0.07 | 43.98 | 2.97 | 37.55 | 1.9970 | 0.4348 | |||
| JNJ / Johnson & Johnson | 0.03 | 1.47 | 2.78 | -0.47 | 1.8673 | -0.1513 | |||
| LMT / Lockheed Martin Corporation | 0.01 | -0.39 | 2.72 | 4.97 | 1.8310 | -0.0458 | |||
| LLY / Eli Lilly and Company | 0.04 | -0.15 | 2.72 | 6.21 | 1.8290 | -0.0240 | |||
| INTC / Intel Corporation | 0.07 | 0.52 | 2.71 | 4.80 | 1.8202 | -0.0486 | |||
| BMY / Bristol-Myers Squibb Company | 0.04 | -0.17 | 2.48 | 15.18 | 1.6677 | 0.1098 | |||
| T / AT&T Inc. | 0.07 | 1.16 | 2.44 | -3.56 | 1.6388 | -0.1896 | |||
| MMM / 3M Company | 0.01 | -0.20 | 2.44 | 15.76 | 1.6388 | 0.1156 | |||
| WM / Waste Management, Inc. | 0.05 | -1.98 | 2.41 | 5.80 | 1.6173 | -0.0274 | |||
| AAPL / Apple Inc. | 0.02 | -7.07 | 2.37 | 1.84 | 1.5957 | -0.0902 | |||
| AEP / American Electric Power Company, Inc. | 0.04 | 0.68 | 2.28 | 17.15 | 1.5332 | 0.1251 | |||
| KMB / Kimberly-Clark Corporation | 0.02 | -1.08 | 2.28 | 6.26 | 1.5299 | -0.0193 | |||
| PPL / PPL Corporation | 0.06 | -1.33 | 2.26 | 9.14 | 1.5164 | 0.0215 | |||
| PEAK / Healthpeak Properties, Inc. | 0.05 | 1.70 | 2.23 | 12.76 | 1.5023 | 0.0688 | |||
| PNY / Piedmont Natural Gas Co., Inc. | 0.06 | 1.64 | 2.22 | 19.51 | 1.4902 | 0.1486 | |||
| KRFT / | 0.04 | 1.62 | 2.20 | 12.87 | 1.4795 | 0.0691 | |||
| GE / General Electric Company | 0.08 | -38.33 | 2.05 | -39.15 | 1.3800 | -1.0603 | |||
| BMO / Bank of Montreal | 0.03 | 1.56 | 2.05 | -2.43 | 1.3780 | -0.1416 | |||
| TRP / TC Energy Corporation | 0.04 | 2.43 | 1.97 | -2.38 | 1.3208 | -0.1351 | |||
| CVS / CVS Health Corporation | 0.02 | 6.18 | 1.84 | 28.47 | 1.2375 | 0.2010 | |||
| KO / The Coca-Cola Company | 0.04 | -3.03 | 1.82 | -3.97 | 1.2207 | -0.1470 | |||
| NUE / Nucor Corporation | 0.04 | -3.77 | 1.77 | -13.05 | 1.1871 | -0.2819 | |||
| MAT / Mattel, Inc. | 0.05 | 0.16 | 1.58 | 1.16 | 1.0593 | -0.0675 | |||
| SNDK / Sandisk Corporation | 0.02 | 8.69 | 1.56 | 8.69 | 1.0506 | 0.0106 | |||
| WFC / Wells Fargo & Company | 0.03 | 1.65 | 1.54 | 7.41 | 1.0331 | -0.0018 | |||
| ALL / The Allstate Corporation | 0.02 | 4.55 | 1.52 | 19.70 | 1.0210 | 0.1032 | |||
| AMGN / Amgen Inc. | 0.01 | 7.38 | 1.51 | 21.76 | 1.0157 | 0.1181 | |||
| CSCO / Cisco Systems, Inc. | 0.05 | 2.53 | 1.50 | 13.43 | 1.0103 | 0.0520 | |||
| PTC / PTC Inc. | 0.04 | 6.23 | 1.50 | 5.56 | 1.0076 | -0.0194 | |||
| HD / The Home Depot, Inc. | 0.01 | 3.80 | 1.49 | 18.80 | 1.0022 | 0.0945 | |||
| IJH / iShares Trust - iShares Core S&P Mid-Cap ETF | 0.01 | -36.24 | 1.46 | -32.48 | 0.9794 | -0.5814 | |||
| WMT / Walmart Inc. | 0.02 | 25.13 | 1.45 | 40.56 | 0.9713 | 0.2278 | |||
| VWO / Vanguard International Equity Index Funds - Vanguard FTSE Emerging Markets ETF | 0.04 | 11.61 | 1.43 | 7.10 | 0.9632 | -0.0045 | |||
| DAL / Delta Air Lines, Inc. | 0.03 | -3.39 | 1.39 | 31.41 | 0.9336 | 0.1692 | |||
| V / Visa Inc. | 0.01 | 9.37 | 1.39 | 34.30 | 0.9316 | 0.1852 | |||
| MRK / Merck & Co., Inc. | 0.02 | 3.11 | 1.38 | -1.29 | 0.9289 | -0.0836 | |||
| DIS / The Walt Disney Company | 0.01 | -12.04 | 1.33 | -6.90 | 0.8974 | -0.1398 | |||
| GS / The Goldman Sachs Group, Inc. | 0.01 | 5.45 | 1.33 | 11.29 | 0.8947 | 0.0297 | |||
| CELG / Celgene Corp. | 0.01 | -0.29 | 1.33 | 17.61 | 0.8933 | 0.0760 | |||
| CAH / Cardinal Health, Inc. | 0.02 | -0.87 | 1.29 | 6.72 | 0.8644 | -0.0071 | |||
| FL / Foot Locker, Inc. | 0.02 | 5.44 | 1.28 | 6.37 | 0.8637 | -0.0099 | |||
| IM / Ingram Micro Inc. | 0.05 | 11.43 | 1.28 | 19.33 | 0.8631 | 0.0849 | |||
| QCOM / QUALCOMM Incorporated | 0.02 | -1.77 | 1.28 | -2.37 | 0.8577 | -0.0876 | |||
| STI / Solidion Technology, Inc. | 0.03 | 9.25 | 1.26 | 20.48 | 0.8503 | 0.0909 | |||
| ORCL / Oracle Corporation | 0.03 | 12.96 | 1.26 | 32.70 | 0.8483 | 0.1605 | |||
| SYF / Synchrony Financial | 0.04 | 12.33 | 1.25 | 36.16 | 0.0000 | ||||
| GD / General Dynamics Corporation | 0.01 | 7.32 | 1.23 | 16.26 | 0.8268 | 0.0616 | |||
| GT / The Goodyear Tire & Rubber Company | 0.04 | 8.60 | 1.22 | 37.44 | 0.8167 | 0.1773 | |||
| USB / U.S. Bancorp | 0.03 | 7.65 | 1.20 | 15.78 | 0.8039 | 0.0568 | |||
| UNP / Union Pacific Corporation | 0.01 | 1.20 | 0.0000 | ||||||
| C / Citigroup Inc. | 0.02 | 1.26 | 1.20 | 5.75 | 0.8032 | -0.0140 | |||
| TSN / Tyson Foods, Inc. | 0.03 | 8.90 | 1.17 | 10.94 | 0.7838 | 0.0236 | |||
| NVR / NVR, Inc. | 0.00 | 9.89 | 1.16 | 24.01 | 0.7811 | 0.1034 | |||
| LNC / Lincoln National Corporation | 0.02 | 12.91 | 1.15 | 21.55 | 0.0000 | ||||
| PCP / Precision Castparts Corporation | 0.00 | 13.73 | 1.13 | 15.59 | 0.0000 | ||||
| CAT / Caterpillar Inc. | 0.01 | -23.62 | 1.06 | -29.47 | 0.7159 | -0.3762 | |||
| BWA / BorgWarner Inc. | 0.02 | 6.37 | 1.05 | 11.11 | 0.7058 | 0.0223 | |||
| MDT / Medtronic plc | 0.01 | 9.39 | 1.04 | 27.51 | 0.7011 | 0.1095 | |||
| UGI / UGI Corporation | 0.03 | 1.02 | 0.0000 | ||||||
| LRCX / Lam Research Corporation | 0.01 | 0.99 | 0.0000 | ||||||
| BUD / Anheuser-Busch InBev SA/NV - Depositary Receipt (Common Stock) | 0.01 | 7.03 | 0.99 | 8.47 | 0.6628 | 0.0053 | |||
| MCD / McDonald's Corporation | 0.01 | -6.93 | 0.98 | -7.95 | 0.6614 | -0.1117 | |||
| VLO / Valero Energy Corporation | 0.02 | 13.74 | 0.97 | 21.63 | 0.6540 | 0.0754 | |||
| 772739207 / Rock-Tenn | 0.02 | 8.27 | 0.97 | 38.83 | 0.0000 | ||||
| CMI / Cummins Inc. | 0.01 | 0.97 | 0.0000 | ||||||
| NVO / Novo Nordisk A/S - Depositary Receipt (Common Stock) | 0.02 | 0.00 | 0.95 | -11.11 | 0.0000 | ||||
| PSX / Phillips 66 | 0.01 | 13.45 | 0.94 | 0.00 | 0.6339 | -0.0482 | |||
| 06740C337 / Barclays ETN+ S&P VEQTOR ETN due on 9/8/2020 | 0.01 | 7.39 | 0.93 | 9.32 | 0.6231 | 0.0098 | |||
| BAX / Baxter International Inc. | 0.01 | 0.20 | 0.90 | 2.40 | 0.6029 | -0.0306 | |||
| GILD / Gilead Sciences, Inc. | 0.01 | 8.44 | 0.84 | -3.99 | 0.0000 | ||||
| US00C4U1L353 / Mylan N.V. | 0.01 | 13.52 | 0.79 | 40.61 | 0.5283 | 0.1240 | |||
| HAL / Halliburton Company | 0.02 | 18.83 | 0.77 | -27.60 | 0.5203 | -0.2529 | |||
| LYB / LyondellBasell Industries N.V. | 0.01 | 8.94 | 0.69 | -20.57 | 0.0000 | ||||
| XOM / Exxon Mobil Corporation | 0.01 | 4.48 | 0.61 | 2.84 | 0.4134 | -0.0191 | |||
| SLB / Schlumberger Limited | 0.01 | 0.61 | 0.0000 | ||||||
| BHI / Baker Hughes Inc. | 0.01 | -50.65 | 0.48 | -57.42 | 0.3260 | -0.4978 | |||
| CL / Colgate-Palmolive Company | 0.01 | 0.00 | 0.42 | 6.06 | 0.2823 | -0.0041 | |||
| DUK / Duke Energy Corporation | 0.00 | -12.61 | 0.42 | -2.35 | 0.2796 | -0.0285 | |||
| PG / The Procter & Gamble Company | 0.00 | 6.12 | 0.40 | 15.50 | 0.2655 | 0.0182 | |||
| C.WSA / Citigroup, Inc. | 0.00 | 0.50 | 0.36 | 9.12 | 0.2413 | 0.0034 | |||
| AFL / Aflac Incorporated | 0.01 | 0.00 | 0.32 | 5.25 | 0.2158 | -0.0048 | |||
| NSC / Norfolk Southern Corporation | 0.00 | -8.95 | 0.31 | -10.32 | 0.2104 | -0.0420 | |||
| BAC / Bank of America Corporation | 0.02 | 4.23 | 0.30 | 9.35 | 0.2043 | 0.0033 | |||
| UPS / United Parcel Service, Inc. | 0.00 | -1.47 | 0.30 | 11.57 | 0.2010 | 0.0071 | |||
| IVV / iShares Trust - iShares Core S&P 500 ETF | 0.00 | 5.93 | 0.30 | 10.45 | 0.1990 | 0.0051 | |||
| TXN / Texas Instruments Incorporated | 0.01 | 0.00 | 0.29 | 11.97 | 0.1949 | 0.0076 | |||
| RTX / RTX Corporation | 0.00 | -69.07 | 0.26 | -66.32 | 0.1748 | -0.3836 | |||
| GNTX / Gentex Corporation | 0.01 | 0.26 | 0.0000 | ||||||
| PEP / PepsiCo, Inc. | 0.00 | -4.05 | 0.25 | -2.32 | 0.0000 | ||||
| ACN / Accenture plc | 0.00 | 12.47 | 0.25 | 23.76 | 0.0000 | ||||
| OMC / Omnicom Group Inc. | 0.00 | 0.00 | 0.25 | 12.27 | 0.1660 | 0.0069 | |||
| US0549371070 / BB&T Corp. | 0.01 | 0.00 | 0.24 | 4.70 | 0.1647 | -0.0046 | |||
| GPC / Genuine Parts Company | 0.00 | 0.24 | 0.0000 | ||||||
| SYK / Stryker Corporation | 0.00 | 0.00 | 0.24 | 17.07 | 0.1613 | 0.0131 | |||
| SON / Sonoco Products Company | 0.01 | -15.52 | 0.24 | -5.98 | 0.0000 | ||||
| IWC / iShares Trust - iShares Micro-Cap ETF | 0.00 | 0.00 | 0.23 | 10.95 | 0.1566 | 0.0047 | |||
| FCNCA / First Citizens BancShares, Inc. | 0.00 | 0.23 | 0.0000 | ||||||
| IWF / iShares Trust - iShares Russell 1000 Growth ETF | 0.00 | 4.82 | 0.23 | 9.57 | 0.1539 | 0.0028 | |||
| WMB / The Williams Companies, Inc. | 0.01 | 1.62 | 0.23 | -17.52 | 0.1519 | -0.0463 | |||
| CB / Chubb Limited | 0.00 | 0.00 | 0.22 | 9.27 | 0.1506 | 0.0023 | |||
| AXP / American Express Company | 0.00 | 0.00 | 0.22 | 6.19 | 0.1499 | -0.0020 | |||
| DLR / Digital Realty Trust, Inc. | 0.00 | -9.58 | 0.21 | -4.05 | 0.0000 | ||||
| SO / The Southern Company | 0.00 | 0.20 | 0.0000 | ||||||
| JPM / JPMorgan Chase & Co. | 0.00 | -15.31 | 0.20 | -11.74 | 0.1365 | -0.0299 | |||
| EPD / Enterprise Products Partners L.P. - Limited Partnership | 0.01 | 12.40 | 0.20 | 0.50 | 0.0000 | ||||
| PNW / Pinnacle West Capital Corporation | 0.00 | -100.00 | 0.00 | -100.00 | 0.0000 | ||||
| NTRS / Northern Trust Corporation | 0.00 | -100.00 | 0.00 | -100.00 | -0.1468 | ||||
| HP / Helmerich & Payne, Inc. | 0.00 | -100.00 | 0.00 | -100.00 | -0.1577 | ||||
| RAD / Rite Aid Corp. | 0.00 | -100.00 | 0.00 | -100.00 | -0.0680 | ||||
| IGSB / iShares Trust - iShares 1-5 Year Investment Grade Corporate Bond ETF | 0.00 | -100.00 | 0.00 | -100.00 | -0.3038 | ||||
| EW / Edwards Lifesciences Corporation | 0.00 | -100.00 | 0.00 | -100.00 | 0.0000 | ||||
| CONVERSANT INC / (21249J105) | 0.00 | -100.00 | 0.00 | 0.0000 |