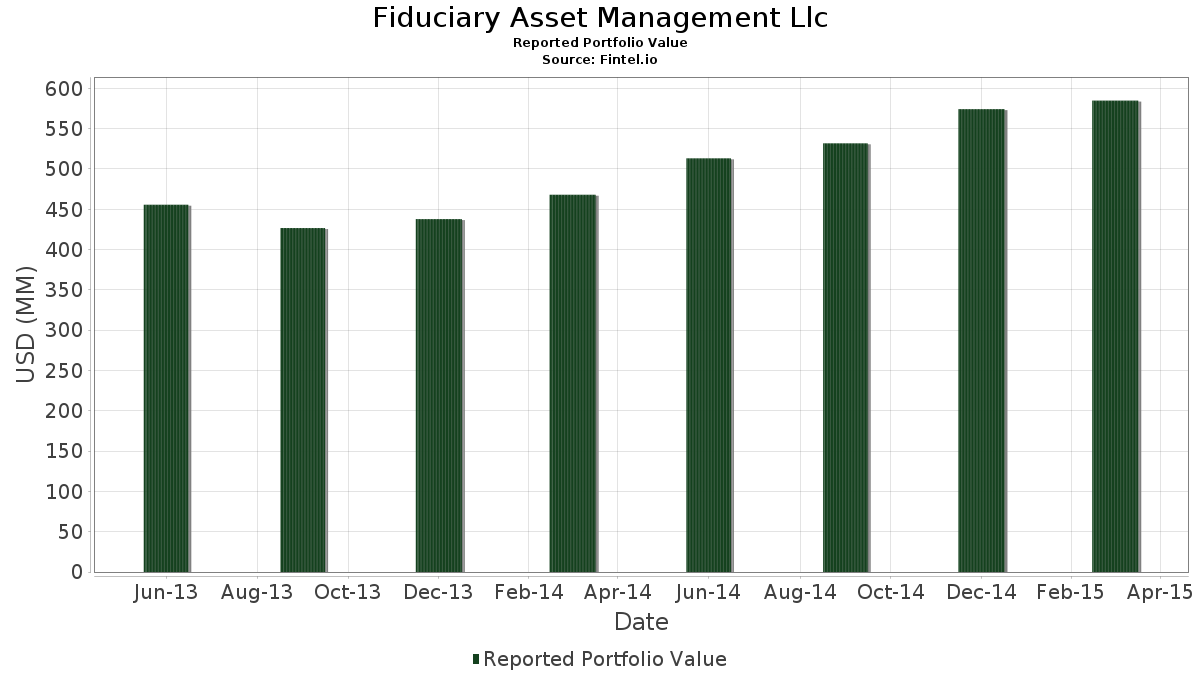
Basic Stats
| Portfolio Value | $ 584,802,000 |
| Current Positions | 86 |
Latest Holdings, Performance, AUM (from 13F, 13D)
Fiduciary Asset Management Llc has disclosed 86 total holdings in their latest SEC filings. Most recent portfolio value is calculated to be $ 584,802,000 USD. Actual Assets Under Management (AUM) is this value plus cash (which is not disclosed). Fiduciary Asset Management Llc’s top holdings are The Coca-Cola Company (US:KO) , Union Pacific Corporation (US:UNP) , Apple Inc. (US:AAPL) , Whirlpool Corporation (US:WHR) , and The Home Depot, Inc. (US:HD) . Fiduciary Asset Management Llc’s new positions include Ford Motor Company (US:F) , Macy's, Inc. (US:M) , Walgreens Boots Alliance, Inc. (US:WBA) , Western Midstream Partners, LP - Limited Partnership (US:WES) , and .
Top Increases This Quarter
We use the change in the portfolio allocation because this is the most meaningful metric. Changes can be due to trades or changes in share prices.
| Security | Shares (MM) |
Value (MM$) |
Portfolio % | ΔPortfolio % |
|---|---|---|---|---|
| 0.32 | 15.15 | 2.5903 | 2.5903 | |
| 0.90 | 14.56 | 2.4902 | 2.4902 | |
| 0.06 | 12.62 | 2.1587 | 1.9884 | |
| 0.10 | 10.09 | 1.7252 | 1.6806 | |
| 0.13 | 8.71 | 1.4892 | 1.4892 | |
| 0.28 | 12.42 | 2.1231 | 0.6548 | |
| 0.19 | 18.38 | 3.1423 | 0.6485 | |
| 0.19 | 23.14 | 3.9569 | 0.6288 | |
| 0.29 | 14.22 | 2.4311 | 0.3332 | |
| 0.02 | 1.92 | 0.3285 | 0.3285 |
Top Decreases This Quarter
We use the change in the portfolio allocation because this is the most meaningful metric. Changes can be due to trades or changes in share prices.
| Security | Shares (MM) |
Value (MM$) |
Portfolio % | ΔPortfolio % |
|---|---|---|---|---|
| 0.04 | 2.68 | 0.4578 | -2.2100 | |
| 0.03 | 3.11 | 0.5318 | -1.2671 | |
| 0.08 | 4.27 | 0.7302 | -1.2620 | |
| 0.03 | 2.42 | 0.4142 | -0.9939 | |
| 0.00 | 0.00 | -0.7583 | ||
| 0.24 | 25.84 | 4.4186 | -0.6635 | |
| 0.11 | 13.27 | 2.2698 | -0.5391 | |
| 0.03 | 1.43 | 0.2442 | -0.2923 | |
| 0.10 | 10.50 | 1.7962 | -0.2718 | |
| 0.12 | 13.08 | 2.2365 | -0.2445 |
13F and Fund Filings
This form was filed on 2015-04-14 for the reporting period 2015-03-31. Click the link icon to see the full transaction history.
Upgrade to unlock premium data and export to Excel ![]() .
.
| Security | Type | Avg Share Price | Shares (MM) |
ΔShares (%) |
ΔShares (%) |
Value ($MM) |
Portfolio (%) |
ΔPortfolio (%) |
|
|---|---|---|---|---|---|---|---|---|---|
| KO / The Coca-Cola Company | 0.95 | 7.84 | 38.64 | 3.58 | 6.6067 | 0.1103 | |||
| UNP / Union Pacific Corporation | 0.24 | -2.60 | 25.84 | -11.45 | 4.4186 | -0.6635 | |||
| AAPL / Apple Inc. | 0.19 | 7.42 | 23.14 | 21.09 | 3.9569 | 0.6288 | |||
| WHR / Whirlpool Corporation | 0.10 | -3.96 | 19.66 | 0.16 | 3.3627 | -0.0565 | |||
| HD / The Home Depot, Inc. | 0.16 | -4.15 | 18.73 | 3.75 | 3.2033 | 0.0587 | |||
| PEP / PepsiCo, Inc. | 0.19 | 26.91 | 18.38 | 28.33 | 3.1423 | 0.6485 | |||
| CVS / CVS Health Corporation | 0.17 | -3.68 | 17.73 | 3.23 | 3.0309 | 0.0405 | |||
| JNJ / Johnson & Johnson | 0.17 | 7.03 | 16.97 | 2.97 | 2.9018 | 0.0316 | |||
| GE / General Electric Company | 0.63 | -0.33 | 15.68 | -2.15 | 2.6811 | -0.1094 | |||
| PFE / Pfizer Inc. | 0.45 | -7.38 | 15.59 | 3.44 | 2.6650 | 0.0410 | |||
| HON / Honeywell International Inc. | 0.15 | 0.52 | 15.58 | 4.94 | 2.6641 | 0.0785 | |||
| DOW / Dow Inc. | 0.32 | 2.76 | 15.15 | 8.10 | 2.5903 | 2.5903 | |||
| BAX / Baxter International Inc. | 0.22 | 19.85 | 15.10 | 12.01 | 2.5816 | 0.2343 | |||
| F / Ford Motor Company | 0.90 | 14.56 | 2.4902 | 2.4902 | |||||
| T / AT&T Inc. | 0.44 | 16.31 | 14.46 | 13.05 | 2.4726 | 0.2450 | |||
| VZ / Verizon Communications Inc. | 0.29 | 13.52 | 14.22 | 18.02 | 2.4311 | 0.3332 | |||
| C.WSA / Citigroup, Inc. | 0.04 | -0.27 | 14.01 | 2.04 | 2.3950 | 0.0045 | |||
| CSCO / Cisco Systems, Inc. | 0.50 | -4.24 | 13.82 | -5.24 | 2.3629 | -0.1767 | |||
| JPM / JPMorgan Chase & Co. | 0.22 | 0.67 | 13.40 | -2.54 | 2.2917 | -0.1031 | |||
| WMT / Walmart Inc. | 0.16 | 12.65 | 13.35 | 7.90 | 2.2830 | 0.1280 | |||
| RTX / RTX Corporation | 0.11 | -19.25 | 13.27 | -17.70 | 2.2698 | -0.5391 | |||
| RTN / Raytheon Co. | 0.12 | -9.10 | 13.08 | -8.19 | 2.2365 | -0.2445 | |||
| SPY / SPDR S&P 500 ETF | 0.06 | 1,185.81 | 12.62 | 1,190.80 | 2.1587 | 1.9884 | |||
| DAL / Delta Air Lines, Inc. | 0.28 | 61.12 | 12.42 | 47.27 | 2.1231 | 0.6548 | |||
| LMT / Lockheed Martin Corporation | 0.06 | -3.60 | 12.25 | 1.60 | 2.0952 | -0.0051 | |||
| EMC / Global X Funds - Global X Emerging Markets Great Consumer ETF | 0.47 | 25.47 | 11.95 | 7.84 | 2.0436 | 0.1136 | |||
| TWX / Warner Media LLC | 0.13 | -4.33 | 11.40 | -5.43 | 1.9487 | -0.1499 | |||
| CVX / Chevron Corporation | 0.10 | -5.47 | 10.50 | -11.54 | 1.7962 | -0.2718 | |||
| UPS / United Parcel Service, Inc. | 0.10 | 4,415.31 | 10.09 | 3,841.02 | 1.7252 | 1.6806 | |||
| EPD / Enterprise Products Partners L.P. - Limited Partnership | 0.30 | -0.26 | 9.99 | -9.06 | 1.7088 | -0.2050 | |||
| M / Macy's, Inc. | 0.13 | 8.71 | 1.4892 | 1.4892 | |||||
| IBM / International Business Machines Corporation | 0.05 | 20.73 | 8.57 | 20.78 | 1.4658 | 0.2298 | |||
| COP / ConocoPhillips | 0.13 | -3.02 | 7.98 | -12.57 | 1.3639 | -0.2249 | |||
| KMI / Kinder Morgan, Inc. | 0.18 | -1.69 | 7.72 | -2.28 | 1.3199 | -0.0557 | |||
| EPC / Edgewell Personal Care Company | 0.04 | 0.00 | 6.16 | 7.39 | 1.0539 | 0.0544 | |||
| PG / The Procter & Gamble Company | 0.07 | -4.17 | 6.04 | -13.78 | 1.0337 | -0.1873 | |||
| MMP / Magellan Midstream Partners L.P. | 0.06 | -0.43 | 4.88 | -7.60 | 0.8352 | -0.0854 | |||
| GIS / General Mills, Inc. | 0.08 | -64.83 | 4.27 | -62.67 | 0.7302 | -1.2620 | |||
| PAA / Plains All American Pipeline, L.P. - Limited Partnership | 0.09 | -0.28 | 4.26 | -5.25 | 0.7285 | -0.0546 | |||
| 30064K105 / Exacttarget, Inc. | 0.05 | -2.37 | 3.24 | 7.81 | 0.5545 | 0.0307 | |||
| 19041P105 / CBS Corp. | 0.05 | 0.00 | 3.13 | 9.58 | 0.5361 | 0.0378 | |||
| KMB / Kimberly-Clark Corporation | 0.03 | -67.51 | 3.11 | -69.89 | 0.5318 | -1.2671 | |||
| TGT / Target Corporation | 0.04 | 0.00 | 2.87 | 8.09 | 0.4911 | 0.0284 | |||
| QCOM / QUALCOMM Incorporated | 0.04 | -81.27 | 2.68 | -82.52 | 0.4578 | -2.2100 | |||
| US1182301010 / Buckeye Partners, L.P. | 0.03 | -1.13 | 2.51 | -1.34 | 0.4294 | -0.0139 | |||
| DFS / Discover Financial Services | 0.04 | 76.01 | 2.43 | 51.40 | 0.4155 | 0.1360 | |||
| AXP / American Express Company | 0.03 | -64.32 | 2.42 | -70.04 | 0.4142 | -0.9939 | |||
| ETN / Eaton Corporation plc | 0.03 | 0.00 | 2.24 | -0.04 | 0.3834 | -0.0073 | |||
| TJX / The TJX Companies, Inc. | 0.03 | -3.39 | 2.23 | -1.33 | 0.3810 | -0.0123 | |||
| INTC / Intel Corporation | 0.07 | 598.50 | 2.19 | 501.65 | 0.3745 | 0.3111 | |||
| EEP / Enbridge Energy Partners, L.P. | 0.06 | 0.00 | 2.04 | -9.75 | 0.3483 | -0.0447 | |||
| CAT / Caterpillar Inc. | 0.02 | 1.92 | 0.3285 | 0.3285 | |||||
| STJ / St. Jude Medical, Inc. | 0.03 | 0.00 | 1.64 | 0.55 | 0.2796 | -0.0036 | |||
| US87233Q1085 / TC Pipelines, LP | 0.02 | -1.36 | 1.61 | -9.75 | 0.2755 | -0.0354 | |||
| OXY / Occidental Petroleum Corporation | 0.02 | 0.00 | 1.47 | -9.44 | 0.2509 | -0.0313 | |||
| EMR / Emerson Electric Co. | 0.03 | -28.74 | 1.43 | -37.61 | 0.2442 | -0.2923 | |||
| WES / Western Midstream Partners, LP - Limited Partnership | 0.02 | 2.39 | 1.38 | -7.67 | 0.2367 | -0.0244 | |||
| WPZ / Access Midstream Partners, L.P | 0.03 | -8.66 | 1.36 | 0.44 | 0.2331 | -0.0033 | |||
| SXL / Sunoco Logistics Partners L.P. | 0.02 | 0.00 | 1.31 | -14.23 | 0.2237 | -0.0419 | |||
| GEL / Genesis Energy, L.P. - Limited Partnership | 0.02 | -1.54 | 1.10 | 9.05 | 0.1876 | 0.0124 | |||
| WBA / Walgreens Boots Alliance, Inc. | 0.01 | 1.02 | 0.1737 | 0.1737 | |||||
| XOM / Exxon Mobil Corporation | 0.01 | 0.00 | 0.84 | -8.00 | 0.1435 | -0.0154 | |||
| OKS / ONEOK Partners, L.P. | 0.02 | 0.00 | 0.80 | 2.96 | 0.1366 | 0.0015 | |||
| DCP / DCP Midstream LP - Unit | 0.02 | -0.40 | 0.79 | -19.06 | 0.1351 | -0.0349 | |||
| EEQ / Enbridge Energy Management LLC. | 0.02 | 1.53 | 0.55 | -4.85 | 0.0939 | -0.0066 | |||
| HSIC / Henry Schein, Inc. | 0.00 | -25.05 | 0.52 | -23.04 | 0.0891 | -0.0288 | |||
| AET / Aetna, Inc. | 0.00 | -32.05 | 0.48 | -18.43 | 0.0817 | -0.0203 | |||
| KDP / Keurig Dr Pepper Inc. | 0.01 | 0.00 | 0.46 | 9.38 | 0.0778 | 0.0054 | |||
| RGP / Resources Connection, Inc. | 0.02 | 0.00 | 0.40 | -4.49 | 0.0691 | -0.0046 | |||
| AB / AllianceBernstein Holding L.P. - Limited Partnership | 0.01 | 0.00 | 0.39 | 19.39 | 0.0674 | 0.0099 | |||
| TOO / Teekay Offshore Partners L.P. | 0.02 | -1.03 | 0.39 | -22.02 | 0.0660 | -0.0202 | |||
| ANDX / Tesoro Logistics LP | 0.01 | 2.04 | 0.38 | -6.70 | 0.0643 | -0.0059 | |||
| DTE / DTE Energy Company | 0.00 | 0.00 | 0.35 | -6.65 | 0.0600 | -0.0055 | |||
| DOW / Dow Inc. | 0.00 | 0.00 | 0.33 | -3.48 | 0.0569 | -0.0031 | |||
| NGLS / Targa Resources Partners LP | 0.01 | 51.87 | 0.31 | 31.38 | 0.0537 | 0.0121 | |||
| NS / NuStar Energy L.P. - Limited Partnership | 0.01 | 0.00 | 0.31 | 5.37 | 0.0537 | 0.0018 | |||
| MWE / MarkWest Energy Partners, LP | 0.00 | 0.00 | 0.31 | -1.59 | 0.0528 | -0.0018 | |||
| MCD / McDonald's Corporation | 0.00 | -16.34 | 0.29 | -13.21 | 0.0494 | -0.0086 | |||
| KRFT / | 0.00 | 0.27 | 0.0455 | 0.0455 | |||||
| MRK / Merck & Co., Inc. | 0.00 | 0.00 | 0.25 | 1.21 | 0.0427 | -0.0003 | |||
| USB / U.S. Bancorp | 0.01 | 0.00 | 0.23 | -2.55 | 0.0392 | -0.0018 | |||
| WES / Western Midstream Partners, LP - Limited Partnership | 0.00 | 0.22 | 0.0373 | -0.0028 | |||||
| PM / Philip Morris International Inc. | 0.00 | 0.00 | 0.21 | -7.59 | 0.0354 | -0.0036 | |||
| CEQP / Crestwood Equity Partners LP - Unit | 0.03 | -1.89 | 0.19 | -27.44 | 0.0330 | -0.0133 | |||
| ARNGF / Argonaut Gold Inc. | 0.03 | 0.00 | 0.04 | -12.50 | 0.0060 | -0.0010 | |||
| IFUE / Fuel Performance Solutions, Inc. | 0.10 | 0.00 | 0.01 | 0.00 | 0.0014 | -0.0000 | |||
| ROST / Ross Stores, Inc. | 0.00 | -100.00 | 0.00 | -100.00 | -0.7583 |