Basic Stats
| Portfolio Value | $ 10,186,211,409 |
| Current Positions | 54 |
Latest Holdings, Performance, AUM (from 13F, 13D)
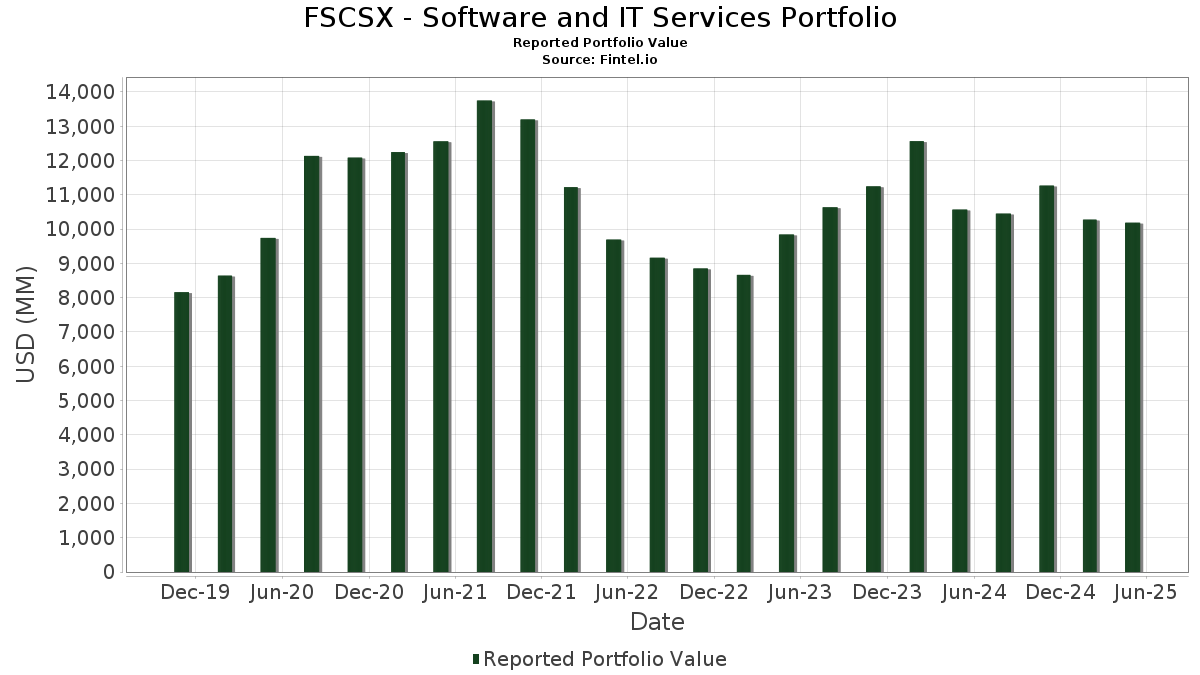
FSCSX - Software and IT Services Portfolio has disclosed 54 total holdings in their latest SEC filings. Most recent portfolio value is calculated to be $ 10,186,211,409 USD. Actual Assets Under Management (AUM) is this value plus cash (which is not disclosed). FSCSX - Software and IT Services Portfolio’s top holdings are Microsoft Corporation (US:MSFT) , Salesforce, Inc. (US:CRM) , Adobe Inc. (US:ADBE) , Intuit Inc. (US:INTU) , and Autodesk, Inc. (US:ADSK) . FSCSX - Software and IT Services Portfolio’s new positions include Zscaler, Inc. (US:ZS) , ServiceNow, Inc. (US:NOW) , monday.com Ltd. (US:MNDY) , AppLovin Corporation (US:APP) , and Palantir Technologies Inc. (US:PLTR) .
Top Increases This Quarter
We use the change in the portfolio allocation because this is the most meaningful metric. Changes can be due to trades or changes in share prices.
| Security | Shares (MM) |
Value (MM$) |
Portfolio % | ΔPortfolio % |
|---|---|---|---|---|
| 0.62 | 469.98 | 4.6231 | 2.1251 | |
| 0.77 | 212.66 | 2.0919 | 2.0919 | |
| 0.18 | 181.62 | 1.7865 | 1.7865 | |
| 0.54 | 160.77 | 1.5815 | 1.5815 | |
| 0.37 | 147.09 | 1.4469 | 1.4469 | |
| 1.10 | 145.14 | 1.4277 | 1.4277 | |
| 2.42 | 285.68 | 2.8103 | 1.3139 | |
| 2.06 | 396.94 | 3.9046 | 1.3040 | |
| 1.52 | 449.19 | 4.4186 | 1.1380 | |
| 0.45 | 209.18 | 2.0577 | 0.8693 |
Top Decreases This Quarter
We use the change in the portfolio allocation because this is the most meaningful metric. Changes can be due to trades or changes in share prices.
| Security | Shares (MM) |
Value (MM$) |
Portfolio % | ΔPortfolio % |
|---|---|---|---|---|
| 2.53 | 670.53 | 6.5960 | -2.0780 | |
| 0.26 | 63.39 | 0.6236 | -2.0010 | |
| 0.23 | 40.19 | 0.3953 | -1.7608 | |
| 1.15 | 479.14 | 4.7133 | -1.5564 | |
| 0.66 | 53.18 | 0.5231 | -1.2051 | |
| 0.84 | 139.46 | 1.3719 | -0.9472 | |
| 0.42 | 28.52 | 0.2806 | -0.9146 | |
| 22.25 | 22.25 | 0.2189 | -0.7563 | |
| 0.57 | 118.26 | 1.1633 | -0.5996 | |
| 2.62 | 84.28 | 0.8291 | -0.5335 |
13F and Fund Filings
This form was filed on 2025-07-24 for the reporting period 2025-05-31. Click the link icon to see the full transaction history.
Upgrade to unlock premium data and export to Excel ![]() .
.
| Security | Type | Avg Share Price | Shares (MM) |
ΔShares (%) |
ΔShares (%) |
Value ($MM) |
Portfolio (%) |
ΔPortfolio (%) |
|
|---|---|---|---|---|---|---|---|---|---|
| MSFT / Microsoft Corporation | 5.50 | -13.29 | 2,530.65 | 0.55 | 24.8938 | 0.4066 | |||
| CRM / Salesforce, Inc. | 2.53 | -15.58 | 670.53 | -24.79 | 6.5960 | -2.0780 | |||
| ADBE / Adobe Inc. | 1.15 | -21.44 | 479.14 | -25.64 | 4.7133 | -1.5564 | |||
| INTU / Intuit Inc. | 0.62 | 49.13 | 469.98 | 83.05 | 4.6231 | 2.1251 | |||
| ADSK / Autodesk, Inc. | 1.52 | 23.37 | 449.19 | 33.22 | 4.4186 | 1.1380 | |||
| PANW / Palo Alto Networks, Inc. | 2.06 | 46.97 | 396.94 | 48.51 | 3.9046 | 1.3040 | |||
| TEAM / Atlassian Corporation | 1.44 | 73.25 | 300.02 | 26.54 | 2.9512 | 0.6444 | |||
| DDOG / Datadog, Inc. | 2.42 | 83.66 | 285.68 | 85.76 | 2.8103 | 1.3139 | |||
| HUBS / HubSpot, Inc. | 0.41 | 22.00 | 242.40 | -0.59 | 2.3845 | 0.0119 | |||
| NET / Cloudflare, Inc. | 1.39 | -2.91 | 229.88 | 10.85 | 2.2613 | 0.2436 | |||
| ACN / Accenture plc | 0.72 | 6.66 | 229.19 | -3.03 | 2.2545 | -0.0452 | |||
| ZS / Zscaler, Inc. | 0.77 | 212.66 | 2.0919 | 2.0919 | |||||
| SNPS / Synopsys, Inc. | 0.45 | 68.79 | 209.18 | 71.26 | 2.0577 | 0.8693 | |||
| TWLO / Twilio Inc. | 1.67 | 15.78 | 196.68 | 13.63 | 1.9348 | 0.2505 | |||
| OKTA / Okta, Inc. | 1.82 | -2.25 | 187.76 | 11.45 | 1.8470 | 0.2078 | |||
| NOW / ServiceNow, Inc. | 0.18 | 181.62 | 1.7865 | 1.7865 | |||||
| MDB / MongoDB, Inc. | 0.91 | 29.14 | 171.46 | -8.81 | 1.6866 | -0.1429 | |||
| MNDY / monday.com Ltd. | 0.54 | 160.77 | 1.5815 | 1.5815 | |||||
| APP / AppLovin Corporation | 0.37 | 147.09 | 1.4469 | 1.4469 | |||||
| PLTR / Palantir Technologies Inc. | 1.10 | 145.14 | 1.4277 | 1.4277 | |||||
| ORCL / Oracle Corporation | 0.84 | -41.30 | 139.46 | -41.49 | 1.3719 | -0.9472 | |||
| FIVN / Five9, Inc. | 5.22 | 49.87 | 138.34 | 9.76 | 1.3609 | 0.1345 | |||
| BL / BlackLine, Inc. | 2.27 | 0.00 | 127.18 | 15.80 | 1.2511 | 0.1824 | |||
| SNOW / Snowflake Inc. | 0.57 | -43.80 | 118.26 | -34.73 | 1.1633 | -0.5996 | |||
| CAP / Capgemini SE | 0.69 | -6.78 | 114.82 | -0.31 | 1.1294 | 0.0088 | |||
| CTSH / Cognizant Technology Solutions Corporation | 1.31 | -29.16 | 106.23 | -31.15 | 1.0450 | -0.4563 | |||
| U / Unity Software Inc. | 4.04 | -8.44 | 105.24 | -6.87 | 1.0352 | -0.0642 | |||
| XYZ / Block, Inc. | 1.67 | -0.45 | 103.41 | -5.86 | 1.0172 | -0.0515 | |||
| EPAM / EPAM Systems, Inc. | 0.59 | -11.70 | 102.33 | -25.26 | 1.0066 | -0.3255 | |||
| TENB / Tenable Holdings, Inc. | 2.62 | -28.76 | 84.28 | -39.82 | 0.8291 | -0.5335 | |||
| GTM / ZoomInfo Technologies Inc. | 8.53 | 25.78 | 81.50 | 3.02 | 0.8018 | 0.0320 | |||
| CDNS / Cadence Design Systems, Inc. | 0.28 | -35.26 | 80.64 | -25.81 | 0.7932 | -0.2643 | |||
| GEN / Gen Digital Inc. | 2.62 | 0.00 | 74.73 | 4.21 | 0.7351 | 0.0374 | |||
| META / Meta Platforms, Inc. | 0.11 | 75.57 | 70.25 | 70.13 | 0.6911 | 0.2893 | |||
| SHOP / Shopify Inc. | 0.64 | 127.25 | 68.91 | 117.55 | 0.6778 | 0.3696 | |||
| CRWD / CrowdStrike Holdings, Inc. | 0.14 | -52.12 | 67.63 | -42.08 | 0.6653 | -0.4709 | |||
| WDAY / Workday, Inc. | 0.26 | -75.02 | 63.39 | -76.50 | 0.6236 | -2.0010 | |||
| CFLT / Confluent, Inc. | 2.73 | -15.60 | 62.79 | -38.76 | 0.6176 | -0.3799 | |||
| AMZN / Amazon.com, Inc. | 0.28 | 56.87 | 0.5594 | 0.5594 | |||||
| ESTC / Elastic N.V. | 0.66 | -56.92 | 53.18 | -70.06 | 0.5231 | -1.2051 | |||
| AMPL / Amplitude, Inc. | 3.93 | -52.23 | 48.67 | -52.99 | 0.4788 | -0.5286 | |||
| US31635A1051 / Fidelity Cash Central Fund | 48.51 | -46.42 | 48.52 | -46.42 | 0.4773 | -0.4038 | |||
| FICO / Fair Isaac Corporation | 0.03 | 45.70 | 0.4496 | 0.4496 | |||||
| TOST / Toast, Inc. | 1.07 | -9.98 | 45.00 | -1.63 | 0.4426 | -0.0024 | |||
| WIX / Wix.com Ltd. | 0.30 | 15.33 | 44.37 | 69.25 | 0.4365 | 0.2039 | |||
| PTC / PTC Inc. | 0.26 | 0.00 | 42.97 | 2.87 | 0.4227 | 0.0163 | |||
| BILL / BILL Holdings, Inc. | 0.96 | 0.00 | 41.89 | -20.87 | 0.4121 | -0.1030 | |||
| GOOGL / Alphabet Inc. | 0.23 | -82.02 | 40.19 | -81.87 | 0.3953 | -1.7608 | |||
| ROP / Roper Technologies, Inc. | 0.06 | 34.00 | 0.3344 | 0.3344 | |||||
| WK / Workiva Inc. | 0.42 | -69.80 | 28.52 | -76.78 | 0.2806 | -0.9146 | |||
| US31635A3032 / Fidelity Securities Lending Cash Central Fund | 22.25 | -77.97 | 22.25 | -77.97 | 0.2189 | -0.7563 | |||
| IBM / International Business Machines Corporation | 0.08 | 20.85 | 0.2051 | 0.2051 | |||||
| DT / Dynatrace, Inc. | 0.15 | -35.58 | 7.90 | -39.23 | 0.0777 | -0.0488 | |||
| CA21037X1345 / CONSTELLATION SOFTWARE INC | 0.03 | 0.00 | 0.00 | 0.0000 | 0.0000 | ||||
| SAIL / SailPoint, Inc. | 0.00 | -100.00 | 0.00 | -100.00 | -0.0135 |