Basic Stats
| Portfolio Value | $ 532,230,061 |
| Current Positions | 67 |
Latest Holdings, Performance, AUM (from 13F, 13D)
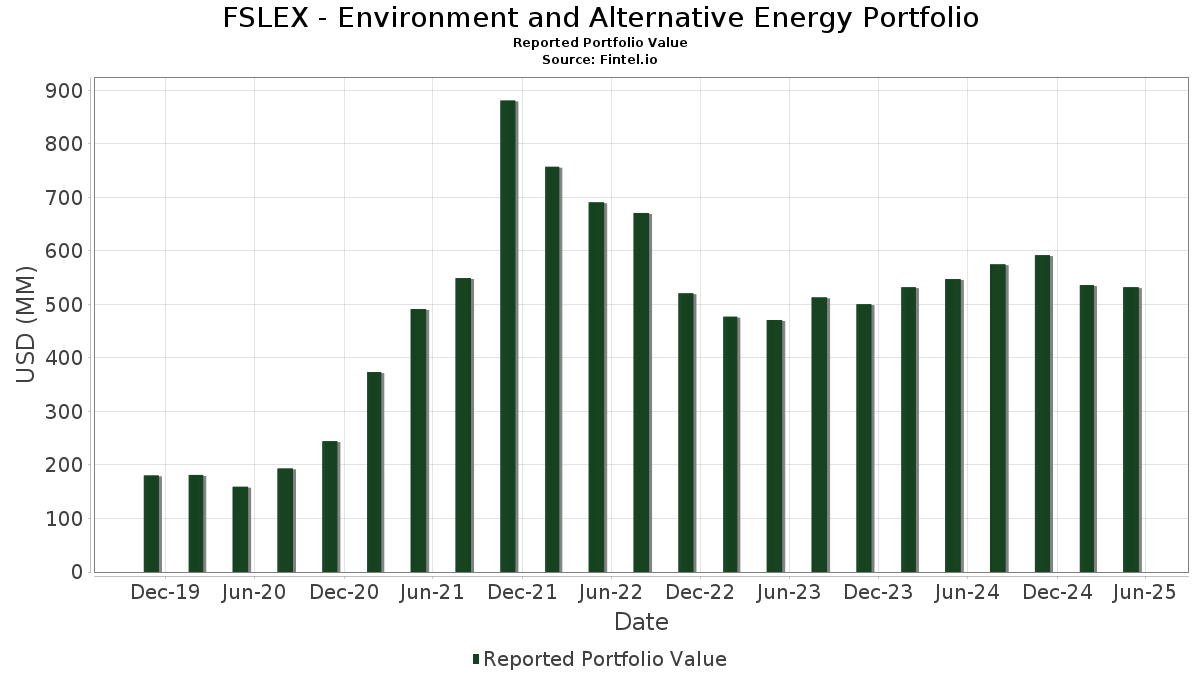
FSLEX - Environment and Alternative Energy Portfolio has disclosed 67 total holdings in their latest SEC filings. Most recent portfolio value is calculated to be $ 532,230,061 USD. Actual Assets Under Management (AUM) is this value plus cash (which is not disclosed). FSLEX - Environment and Alternative Energy Portfolio’s top holdings are Microsoft Corporation (US:MSFT) , Tesla, Inc. (US:TSLA) , International Business Machines Corporation (US:IBM) , Linde plc (US:LIN) , and Prologis, Inc. (US:PLD) .
Top Increases This Quarter
We use the change in the portfolio allocation because this is the most meaningful metric. Changes can be due to trades or changes in share prices.
| Security | Shares (MM) |
Value (MM$) |
Portfolio % | ΔPortfolio % |
|---|---|---|---|---|
| 0.15 | 52.38 | 9.9857 | 3.4811 | |
| 0.15 | 67.55 | 12.8771 | 1.6308 | |
| 0.12 | 11.46 | 2.1848 | 0.8786 | |
| 0.09 | 9.41 | 1.7934 | 0.2524 | |
| 0.06 | 4.57 | 0.8711 | 0.2372 | |
| 0.04 | 15.67 | 2.9863 | 0.1981 | |
| 0.06 | 3.28 | 0.6254 | 0.1565 | |
| 0.04 | 6.25 | 1.1909 | 0.1376 | |
| 0.11 | 3.95 | 0.7526 | 0.1261 | |
| 0.02 | 2.02 | 0.3854 | 0.1109 |
Top Decreases This Quarter
We use the change in the portfolio allocation because this is the most meaningful metric. Changes can be due to trades or changes in share prices.
| Security | Shares (MM) |
Value (MM$) |
Portfolio % | ΔPortfolio % |
|---|---|---|---|---|
| 0.07 | 34.04 | 6.4879 | -0.6041 | |
| 0.18 | 19.45 | 3.7079 | -0.5835 | |
| 0.02 | 0.79 | 0.1515 | -0.5809 | |
| 0.03 | 8.97 | 1.7105 | -0.5766 | |
| 0.00 | 0.00 | -0.4400 | ||
| 7.96 | 7.96 | 1.5166 | -0.4003 | |
| 0.08 | 14.91 | 2.8429 | -0.3853 | |
| 0.01 | 3.36 | 0.6413 | -0.3668 | |
| 0.16 | 14.14 | 2.6963 | -0.3607 | |
| 0.03 | 2.74 | 0.5214 | -0.3140 |
13F and Fund Filings
This form was filed on 2025-07-24 for the reporting period 2025-05-31. Click the link icon to see the full transaction history.
Upgrade to unlock premium data and export to Excel ![]() .
.
| Security | Type | Avg Share Price | Shares (MM) |
ΔShares (%) |
ΔShares (%) |
Value ($MM) |
Portfolio (%) |
ΔPortfolio (%) |
|
|---|---|---|---|---|---|---|---|---|---|
| MSFT / Microsoft Corporation | 0.15 | -1.61 | 67.55 | 14.10 | 12.8771 | 1.6308 | |||
| TSLA / Tesla, Inc. | 0.15 | 29.36 | 52.38 | 52.98 | 9.9857 | 3.4811 | |||
| IBM / International Business Machines Corporation | 0.14 | -5.00 | 36.17 | -2.51 | 6.8943 | -0.1526 | |||
| LIN / Linde plc | 0.07 | -8.94 | 34.04 | -8.84 | 6.4879 | -0.6041 | |||
| PLD / Prologis, Inc. | 0.18 | -1.76 | 19.45 | -13.90 | 3.7079 | -0.5835 | |||
| ETN / Eaton Corporation plc | 0.06 | -11.39 | 18.28 | -3.27 | 3.4852 | -0.1051 | |||
| RSG / Republic Services, Inc. | 0.07 | -13.66 | 18.19 | -6.27 | 3.4670 | -0.2189 | |||
| TT / Trane Technologies plc | 0.04 | -12.27 | 15.67 | 6.73 | 2.9863 | 0.1981 | |||
| NXPI / NXP Semiconductors N.V. | 0.08 | -1.01 | 14.91 | -12.25 | 2.8429 | -0.3853 | |||
| ANET / Arista Networks Inc | 0.16 | -5.61 | 14.14 | -12.11 | 2.6963 | -0.3607 | |||
| NSC / Norfolk Southern Corporation | 0.05 | -4.46 | 11.97 | -3.92 | 2.2823 | -0.0848 | |||
| ENR / Siemens Energy AG | 0.12 | -1.92 | 11.46 | 66.68 | 2.1848 | 0.8786 | |||
| ADI / Analog Devices, Inc. | 0.05 | -2.30 | 10.89 | -9.14 | 2.0762 | -0.2006 | |||
| JCI / Johnson Controls International plc | 0.09 | -2.01 | 9.41 | 15.98 | 1.7934 | 0.2524 | |||
| CMI / Cummins Inc. | 0.03 | -14.65 | 8.97 | -25.47 | 1.7105 | -0.5766 | |||
| US31635A3032 / Fidelity Securities Lending Cash Central Fund | 7.96 | -21.16 | 7.96 | -21.17 | 1.5166 | -0.4003 | |||
| SO / The Southern Company | 0.09 | -2.00 | 7.93 | -1.77 | 1.5118 | -0.0219 | |||
| PCG / PG&E Corporation | 0.46 | -2.53 | 7.74 | 0.69 | 1.4747 | 0.0153 | |||
| WAB / Westinghouse Air Brake Technologies Corporation | 0.04 | -8.78 | 7.40 | -0.43 | 1.4108 | -0.0011 | |||
| BALL / Ball Corporation | 0.14 | -2.17 | 7.26 | -0.52 | 1.3831 | -0.0023 | |||
| FSLR / First Solar, Inc. | 0.04 | -2.95 | 6.25 | 12.66 | 1.1909 | 0.1376 | |||
| CNM / Core & Main, Inc. | 0.10 | -3.11 | 5.47 | 4.11 | 1.0427 | 0.0447 | |||
| CRS / Carpenter Technology Corporation | 0.02 | -7.24 | 5.45 | 5.28 | 1.0384 | 0.0554 | |||
| BKR / Baker Hughes Company | 0.14 | -6.40 | 5.24 | -22.24 | 0.9994 | -0.2811 | |||
| DOX / Amdocs Limited | 0.06 | -3.06 | 5.23 | 1.95 | 0.9961 | 0.0225 | |||
| EQT / EQT Corporation | 0.09 | -3.04 | 5.10 | 10.97 | 0.9720 | 0.0992 | |||
| DE / Deere & Company | 0.01 | 0.00 | 5.05 | 5.30 | 0.9621 | 0.0516 | |||
| ACM / AECOM | 0.04 | -1.10 | 4.93 | 8.59 | 0.9398 | 0.0774 | |||
| KBR / KBR, Inc. | 0.09 | -19.49 | 4.92 | -14.31 | 0.9375 | -0.1526 | |||
| PH / Parker-Hannifin Corporation | 0.01 | -18.44 | 4.88 | -18.92 | 0.9300 | -0.2128 | |||
| ATI / ATI Inc. | 0.06 | 0.00 | 4.57 | 36.92 | 0.8711 | 0.2372 | |||
| CLH / Clean Harbors, Inc. | 0.02 | 0.00 | 4.13 | 6.20 | 0.7864 | 0.0485 | |||
| VST / Vistra Corp. | 0.03 | -7.75 | 4.09 | 10.81 | 0.7796 | 0.0786 | |||
| BLD / TopBuild Corp. | 0.01 | -12.23 | 4.04 | -18.96 | 0.7701 | -0.1768 | |||
| TTEK / Tetra Tech, Inc. | 0.11 | 0.00 | 3.95 | 19.71 | 0.7526 | 0.1261 | |||
| PWR / Quanta Services, Inc. | 0.01 | -24.97 | 3.90 | -1.01 | 0.7438 | -0.0049 | |||
| WWD / Woodward, Inc. | 0.02 | -7.27 | 3.62 | 6.16 | 0.6895 | 0.0422 | |||
| ON / ON Semiconductor Corporation | 0.09 | -1.50 | 3.58 | -12.03 | 0.6829 | -0.0907 | |||
| GEV / GE Vernova Inc. | 0.01 | -31.34 | 3.58 | -3.12 | 0.6816 | -0.0194 | |||
| OLED / Universal Display Corporation | 0.02 | 0.00 | 3.51 | -6.68 | 0.6689 | -0.0454 | |||
| COHR / Coherent Corp. | 0.05 | 0.00 | 3.50 | 0.60 | 0.6666 | 0.0062 | |||
| AYI / Acuity Inc. | 0.01 | 0.00 | 3.47 | -12.54 | 0.6624 | -0.0922 | |||
| GE / General Electric Company | 0.01 | -46.65 | 3.36 | -36.60 | 0.6413 | -0.3668 | |||
| AZEK / The AZEK Company Inc. | 0.07 | -28.09 | 3.36 | -24.01 | 0.6396 | -0.1991 | |||
| AXTA / Axalta Coating Systems Ltd. | 0.11 | -7.51 | 3.30 | -21.33 | 0.6287 | -0.1677 | |||
| CCJ / Cameco Corporation | 0.06 | 0.00 | 3.28 | 32.90 | 0.6254 | 0.1565 | |||
| WMS / Advanced Drainage Systems, Inc. | 0.03 | 0.00 | 3.27 | -1.30 | 0.6225 | -0.0059 | |||
| NXT / Nextracker Inc. | 0.06 | -26.74 | 3.25 | -5.63 | 0.6203 | -0.0348 | |||
| RWEOY / RWE Aktiengesellschaft - Depositary Receipt (Common Stock) | 0.08 | 0.00 | 3.14 | 19.71 | 0.5987 | 0.1003 | |||
| ALGM / Allegro MicroSystems, Inc. | 0.11 | -4.89 | 2.83 | 8.10 | 0.5396 | 0.0423 | |||
| BLDR / Builders FirstSource, Inc. | 0.03 | -19.72 | 2.74 | -37.80 | 0.5214 | -0.3140 | |||
| DHR / Danaher Corporation | 0.01 | 0.00 | 2.58 | -8.60 | 0.4927 | -0.0444 | |||
| AES / The AES Corporation | 0.25 | 0.00 | 2.54 | -12.93 | 0.4839 | -0.0700 | |||
| CMC / Commercial Metals Company | 0.05 | 0.00 | 2.29 | -3.82 | 0.4367 | -0.0157 | |||
| RIVN / Rivian Automotive, Inc. | 0.15 | 0.00 | 2.19 | 22.69 | 0.4176 | 0.0785 | |||
| PCT / PureCycle Technologies, Inc. | 0.23 | 0.00 | 2.15 | -7.65 | 0.4095 | -0.0325 | |||
| LEU / Centrus Energy Corp. | 0.02 | 0.00 | 2.02 | 39.86 | 0.3854 | 0.1109 | |||
| ENPH / Enphase Energy, Inc. | 0.04 | 0.00 | 1.65 | -27.82 | 0.3153 | -0.1199 | |||
| APTIV PLC / EC (JE00BTDN8H13) | 0.02 | 0.00 | 1.57 | 2.61 | 0.2994 | 0.0086 | |||
| KBH / KB Home | 0.03 | 0.00 | 1.57 | -15.45 | 0.2985 | -0.0533 | |||
| A / Agilent Technologies, Inc. | 0.01 | 0.00 | 1.28 | -12.51 | 0.2441 | -0.0339 | |||
| ASPN / Aspen Aerogels, Inc. | 0.17 | 0.00 | 0.95 | -24.30 | 0.1812 | -0.0574 | |||
| FBHS / Fortune Brands Home & Security Inc | 0.02 | -73.53 | 0.79 | -79.41 | 0.1515 | -0.5809 | |||
| VRT / Vertiv Holdings Co | 0.01 | -54.12 | 0.72 | -47.95 | 0.1376 | -0.1259 | |||
| AEHR / Aehr Test Systems, Inc. | 0.07 | 0.00 | 0.64 | -1.09 | 0.1216 | -0.0008 | |||
| US31635A1051 / Fidelity Cash Central Fund | 0.48 | -52.02 | 0.48 | -52.00 | 0.0915 | -0.0795 | |||
| CELLINK CORP SER D PC PP / EP (N/A) | 0.01 | 0.06 | 0.0119 | 0.0119 | |||||
| CYATY / Contemporary Amperex Technology Co., Limited - Depositary Receipt (Common Stock) | 0.00 | -100.00 | 0.00 | -100.00 | -0.4400 | ||||
| 300274 / Sungrow Power Supply Co., Ltd. | 0.00 | -100.00 | 0.00 | -100.00 | -0.1548 |