Basic Stats
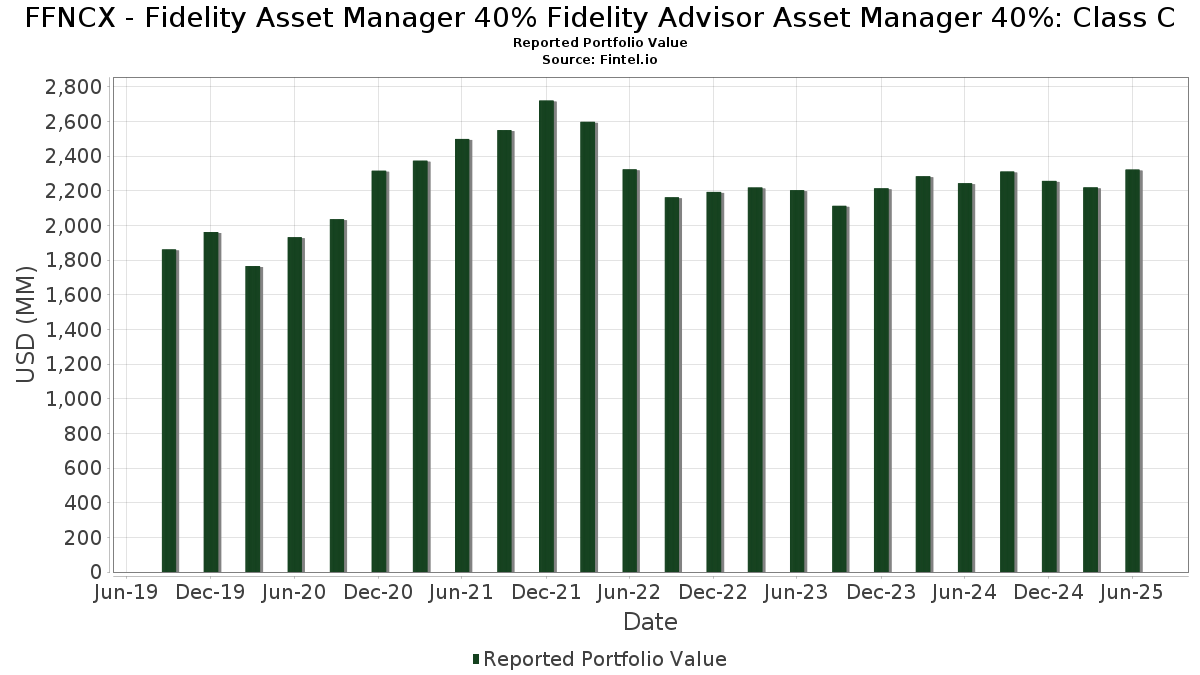
| Portfolio Value | $ 2,322,303,119 |
| Current Positions | 30 |
Latest Holdings, Performance, AUM (from 13F, 13D)
FFNCX - Fidelity Asset Manager 40% Fidelity Advisor Asset Manager 40%: Class C has disclosed 30 total holdings in their latest SEC filings. Most recent portfolio value is calculated to be $ 2,322,303,119 USD. Actual Assets Under Management (AUM) is this value plus cash (which is not disclosed). FFNCX - Fidelity Asset Manager 40% Fidelity Advisor Asset Manager 40%: Class C’s top holdings are Fidelity Investment Grade Bond Central Fund (US:US31606V5003) , Fidelity U.S. Equity Central Fund (US:31606V666) , Fidelity International Equity Central Fund (US:US31606V7165) , Fidelity Cash Central Fund (US:US31635A1051) , and Fidelity Emerging Markets Equity Central Fund (US:US31606V6829) .
Top Increases This Quarter
We use the change in the portfolio allocation because this is the most meaningful metric. Changes can be due to trades or changes in share prices.
| Security | Shares (MM) |
Value (MM$) |
Portfolio % | ΔPortfolio % |
|---|---|---|---|---|
| 0.42 | 45.36 | 1.9682 | 1.2012 | |
| 22.44 | 22.44 | 0.9737 | 0.8681 | |
| 2.46 | 299.97 | 13.0172 | 0.8484 | |
| 3.48 | 499.10 | 21.6582 | 0.5951 | |
| 1.03 | 29.61 | 1.2850 | 0.3119 | |
| 0.52 | 129.11 | 5.6026 | 0.2937 | |
| 0.61 | 56.21 | 2.4390 | 0.2929 | |
| 0.85 | 41.21 | 1.7884 | 0.2559 | |
| 0.26 | 23.78 | 1.0319 | 0.2431 | |
| 0.32 | 28.62 | 1.2420 | 0.2174 |
Top Decreases This Quarter
We use the change in the portfolio allocation because this is the most meaningful metric. Changes can be due to trades or changes in share prices.
| Security | Shares (MM) |
Value (MM$) |
Portfolio % | ΔPortfolio % |
|---|---|---|---|---|
| 190.50 | 190.53 | 8.2681 | -3.3037 | |
| 8.32 | 821.86 | 35.6643 | -0.7750 | |
| 0.04 | 4.83 | 0.2096 | -0.2807 | |
| -2.98 | -0.1295 | -0.1295 | ||
| 0.45 | 15.63 | 0.6781 | -0.1241 | |
| 0.18 | 17.11 | 0.7425 | -0.0268 | |
| 0.28 | 8.82 | 0.3829 | -0.0245 | |
| 0.68 | 18.40 | 0.7984 | -0.0109 | |
| 0.07 | 5.73 | 0.2484 | -0.0093 |
13F and Fund Filings
This form was filed on 2025-08-22 for the reporting period 2025-06-30. Click the link icon to see the full transaction history.
Upgrade to unlock premium data and export to Excel ![]() .
.
| Security | Type | Avg Share Price | Shares (MM) |
ΔShares (%) |
ΔShares (%) |
Value ($MM) |
Portfolio (%) |
ΔPortfolio (%) |
|
|---|---|---|---|---|---|---|---|---|---|
| US31606V5003 / Fidelity Investment Grade Bond Central Fund | 8.32 | 1.21 | 821.86 | 1.51 | 35.6643 | -0.7750 | |||
| 31606V666 / Fidelity U.S. Equity Central Fund | 3.48 | -4.70 | 499.10 | 6.65 | 21.6582 | 0.5951 | |||
| US31606V7165 / Fidelity International Equity Central Fund | 2.46 | -1.04 | 299.97 | 10.95 | 13.0172 | 0.8484 | |||
| US31635A1051 / Fidelity Cash Central Fund | 190.50 | -25.89 | 190.53 | -25.89 | 8.2681 | -3.3037 | |||
| US31606V6829 / Fidelity Emerging Markets Equity Central Fund | 0.52 | -1.60 | 129.11 | 9.46 | 5.6026 | 0.2937 | |||
| .IPBIC / Fidelity Inflation-Protected Bond Index Central Fund | 0.61 | 17.10 | 56.21 | 17.87 | 2.4390 | 0.2929 | |||
| US31606V6902 / Fidelity High Income Central Fund | 0.42 | 159.14 | 45.36 | 166.17 | 1.9682 | 1.2012 | |||
| FESM / Fidelity Covington Trust - Fidelity Enhanced Small Cap ETF | 1.35 | -3.16 | 43.24 | 5.08 | 1.8762 | 0.0244 | |||
| FBCG / Fidelity Covington Trust - Fidelity Blue Chip Growth ETF | 0.85 | 0.29 | 41.21 | 21.05 | 1.7884 | 0.2559 | |||
| FHEQ / Fidelity Greenwood Street Trust - Fidelity Hedged Equity Fund | 1.03 | 25.37 | 29.61 | 36.97 | 1.2850 | 0.3119 | |||
| TLT / iShares Trust - iShares 20+ Year Treasury Bond ETF | 0.32 | 29.68 | 28.62 | 25.72 | 1.2420 | 0.2174 | |||
| 315808709 / Fidelity Emerging Markets Debt Local Currency Central Fund | 0.26 | 26.08 | 23.78 | 35.69 | 1.0319 | 0.2431 | |||
| US31635A3032 / Fidelity Securities Lending Cash Central Fund | 22.44 | 847.01 | 22.44 | 847.11 | 0.9737 | 0.8681 | |||
| FFSM / Fidelity Covington Trust - Fidelity Fundamental Small-Mid Cap ETF | 0.68 | -5.01 | 18.40 | 2.33 | 0.7984 | -0.0109 | |||
| US31606V7082 / Fidelity Floating Rate Central Fund | 0.18 | 0.05 | 17.11 | 0.10 | 0.7425 | -0.0268 | |||
| US3161673039 / Fidelity Commodity Strategy Central Fund | 0.17 | 38.61 | 15.67 | 34.21 | 0.6801 | 0.1545 | |||
| FMDE / Fidelity Covington Trust - Fidelity Enhanced Mid Cap ETF | 0.45 | -20.15 | 15.63 | -12.32 | 0.6781 | -0.1241 | |||
| FELV / Fidelity Covington Trust - Enhanced Large Cap Value ETF | 0.28 | -5.68 | 8.82 | -2.53 | 0.3829 | -0.0245 | |||
| 31607D202 / Fidelity International Credit Central Fund | 0.07 | -0.96 | 5.73 | -0.03 | 0.2484 | -0.0093 | |||
| .RLESTEQ / Fidelity Real Estate Equity Central Fund | 0.04 | -54.22 | 4.83 | -55.66 | 0.2096 | -0.2807 | |||
| UST BILLS 0% 07/10/2025 / DBT (US912797LW51) | 2.77 | 0.1201 | 0.1201 | ||||||
| UST BILLS 0% 07/03/2025 / DBT (US912797NX17) | 1.65 | 0.0716 | 0.0716 | ||||||
| UST BILLS 0% 07/17/2025 / DBT (US912797PE18) | 1.47 | 0.0637 | 0.0637 | ||||||
| UST BILLS 0% 09/18/2025 / DBT (US912797PX98) | 0.88 | 0.0383 | 0.0383 | ||||||
| US 10YR NOTE FUT (CBT)SEP25 TYU5 / DIR (N/A) | 0.48 | 0.0206 | 0.0206 | ||||||
| MSCI EMGMKT FUT SEP25 MESU5 / DE (N/A) | 0.28 | 0.0122 | 0.0122 | ||||||
| MSCI EAFE FUT SEP25 MFSU5 / DE (N/A) | 0.27 | 0.0116 | 0.0116 | ||||||
| UST BILLS 0% 09/25/2025 / DBT (US912797PY71) | 0.14 | 0.0060 | 0.0060 | ||||||
| UST BILLS 0% 07/24/2025 / DBT (US912797PF82) | 0.13 | 0.0056 | 0.0056 | ||||||
| S and P500 EMINI FUT SEP25 ESU5 / DE (N/A) | -2.98 | -0.1295 | -0.1295 |