Basic Stats
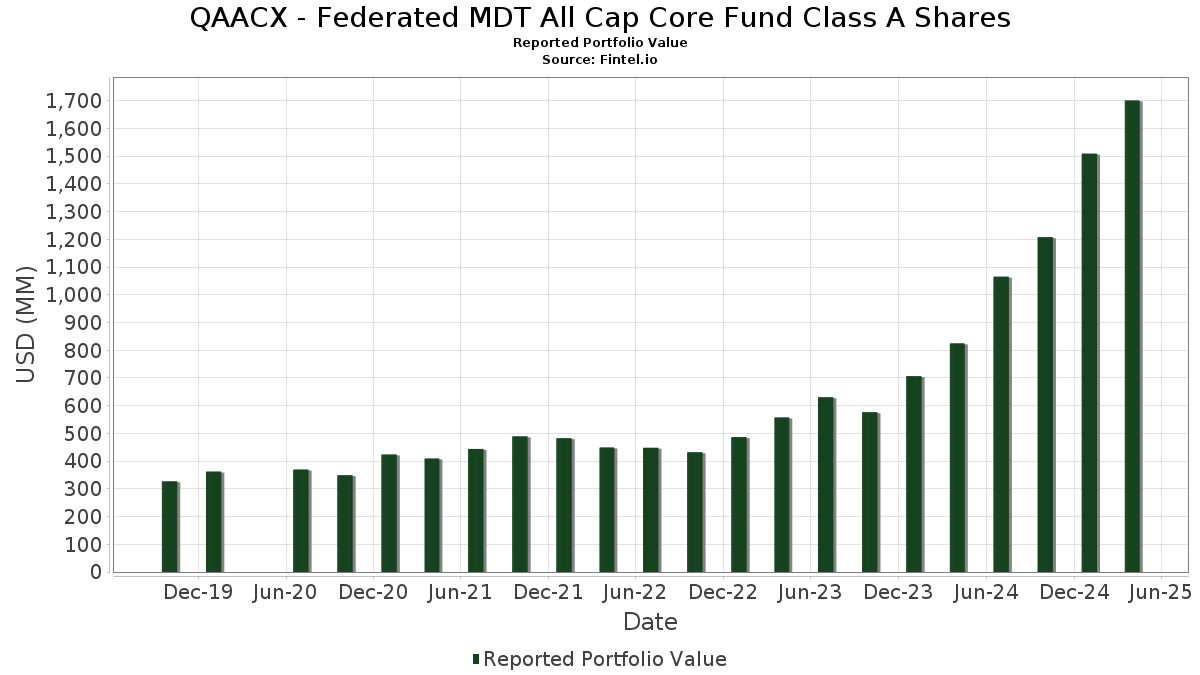
| Portfolio Value | $ 1,700,730,287 |
| Current Positions | 176 |
Latest Holdings, Performance, AUM (from 13F, 13D)
QAACX - Federated MDT All Cap Core Fund Class A Shares has disclosed 176 total holdings in their latest SEC filings. Most recent portfolio value is calculated to be $ 1,700,730,287 USD. Actual Assets Under Management (AUM) is this value plus cash (which is not disclosed). QAACX - Federated MDT All Cap Core Fund Class A Shares’s top holdings are Apple Inc. (US:AAPL) , Microsoft Corporation (US:MSFT) , Alphabet Inc. (US:GOOGL) , QUALCOMM Incorporated (US:QCOM) , and Fortinet, Inc. (US:FTNT) . QAACX - Federated MDT All Cap Core Fund Class A Shares’s new positions include Celanese Corporation (US:CE) , Morgan Stanley (US:MS) , Fox Corporation (US:FOXA) , Welltower Inc. (US:WELL) , and Dollar Tree, Inc. (US:DLTR) .
Top Increases This Quarter
We use the change in the portfolio allocation because this is the most meaningful metric. Changes can be due to trades or changes in share prices.
| Security | Shares (MM) |
Value (MM$) |
Portfolio % | ΔPortfolio % |
|---|---|---|---|---|
| 0.49 | 21.76 | 1.2789 | 1.2789 | |
| 0.29 | 20.47 | 1.2029 | 1.2029 | |
| 0.29 | 21.24 | 1.2485 | 1.0218 | |
| 0.56 | 18.46 | 1.0850 | 0.9393 | |
| 0.08 | 22.50 | 1.3221 | 0.9311 | |
| 0.07 | 24.78 | 1.4564 | 0.9010 | |
| 0.13 | 14.83 | 0.8719 | 0.8719 | |
| 0.29 | 14.64 | 0.8602 | 0.8602 | |
| 0.51 | 14.44 | 0.8489 | 0.8489 | |
| 0.09 | 13.05 | 0.7669 | 0.7669 |
Top Decreases This Quarter
We use the change in the portfolio allocation because this is the most meaningful metric. Changes can be due to trades or changes in share prices.
| Security | Shares (MM) |
Value (MM$) |
Portfolio % | ΔPortfolio % |
|---|---|---|---|---|
| 0.18 | 32.91 | 1.9342 | -1.4333 | |
| 0.05 | 26.41 | 1.5523 | -1.2134 | |
| 0.02 | 2.97 | 0.1744 | -1.1510 | |
| 0.13 | 24.49 | 1.4395 | -1.0524 | |
| 0.00 | 0.00 | -0.8668 | ||
| 39.73 | 39.73 | 2.3352 | -0.7078 | |
| 0.01 | 3.58 | 0.2105 | -0.6685 | |
| 0.13 | 10.50 | 0.6169 | -0.6479 | |
| 0.06 | 2.79 | 0.1641 | -0.5956 | |
| 0.01 | 4.99 | 0.2933 | -0.5890 |
13F and Fund Filings
This form was filed on 2025-06-24 for the reporting period 2025-04-30. Click the link icon to see the full transaction history.
Upgrade to unlock premium data and export to Excel ![]() .
.
| Security | Type | Avg Share Price | Shares (MM) |
ΔShares (%) |
ΔShares (%) |
Value ($MM) |
Portfolio (%) |
ΔPortfolio (%) |
|
|---|---|---|---|---|---|---|---|---|---|
| AAPL / Apple Inc. | 0.32 | 16.92 | 67.95 | 5.27 | 3.9936 | -0.2827 | |||
| MSFT / Microsoft Corporation | 0.17 | 23.35 | 67.31 | 17.46 | 3.9563 | 0.1596 | |||
| GOOGL / Alphabet Inc. | 0.42 | 42.28 | 67.00 | 10.74 | 3.9377 | -0.0705 | |||
| QCOM / QUALCOMM Incorporated | 0.28 | 17.14 | 41.02 | 0.56 | 2.4110 | -0.2917 | |||
| FTNT / Fortinet, Inc. | 0.39 | 53.24 | 40.24 | 57.61 | 2.3650 | 0.6735 | |||
| GOFXX / Federated Hermes Money Market Obligations Trust - Federated Hermes Gov Oblig Fd Prem Shs USD | 39.73 | -13.49 | 39.73 | -13.49 | 2.3352 | -0.7078 | |||
| NVDA / NVIDIA Corporation | 0.35 | 4.96 | 38.44 | -4.78 | 2.2595 | -0.4155 | |||
| ABBV / AbbVie Inc. | 0.19 | 14.74 | 36.64 | 21.73 | 2.1537 | 0.1593 | |||
| AMZN / Amazon.com, Inc. | 0.18 | -16.55 | 32.91 | -35.25 | 1.9342 | -1.4333 | |||
| SPOT / Spotify Technology S.A. | 0.05 | 2.66 | 28.95 | 14.91 | 1.7015 | 0.0323 | |||
| AMGN / Amgen Inc. | 0.10 | 27.76 | 27.87 | 30.22 | 1.6383 | 0.2201 | |||
| GEV / GE Vernova Inc. | 0.08 | -3.80 | 27.86 | -4.33 | 1.6375 | -0.2919 | |||
| VLTO / Veralto Corporation | 0.28 | -1.38 | 27.26 | -8.53 | 1.6024 | -0.3723 | |||
| META / Meta Platforms, Inc. | 0.05 | -20.58 | 26.41 | -36.73 | 1.5523 | -1.2134 | |||
| ADBE / Adobe Inc. | 0.07 | 244.83 | 24.78 | 195.60 | 1.4564 | 0.9010 | |||
| GDDY / GoDaddy Inc. | 0.13 | -26.47 | 24.49 | -34.88 | 1.4395 | -1.0524 | |||
| STT / State Street Corporation | 0.28 | 3.87 | 24.39 | -9.95 | 1.4333 | -0.3610 | |||
| COST / Costco Wholesale Corporation | 0.02 | 5.20 | 22.78 | 6.77 | 1.3392 | -0.0747 | |||
| PGR / The Progressive Corporation | 0.08 | 233.35 | 22.50 | 281.14 | 1.3221 | 0.9311 | |||
| CE / Celanese Corporation | 0.49 | 21.76 | 1.2789 | 1.2789 | |||||
| TER / Teradyne, Inc. | 0.29 | 868.58 | 21.24 | 520.75 | 1.2485 | 1.0218 | |||
| AMP / Ameriprise Financial, Inc. | 0.04 | 2.72 | 20.64 | -10.95 | 1.2128 | -0.3225 | |||
| DXCM / DexCom, Inc. | 0.29 | 20.47 | 1.2029 | 1.2029 | |||||
| AAP / Advance Auto Parts, Inc. | 0.56 | 1,144.67 | 18.46 | 739.85 | 1.0850 | 0.9393 | |||
| BK / The Bank of New York Mellon Corporation | 0.22 | 11.66 | 17.91 | 4.49 | 1.0527 | -0.0830 | |||
| TRV / The Travelers Companies, Inc. | 0.07 | 19.44 | 17.85 | 28.67 | 1.0490 | 0.1300 | |||
| PRU / Prudential Financial, Inc. | 0.17 | -7.78 | 17.03 | -21.56 | 1.0008 | -0.4375 | |||
| NTNX / Nutanix, Inc. | 0.24 | 2.93 | 16.30 | 2.83 | 0.9581 | -0.0921 | |||
| PM / Philip Morris International Inc. | 0.09 | -7.89 | 16.20 | 21.23 | 0.9524 | 0.0668 | |||
| ICE / Intercontinental Exchange, Inc. | 0.09 | -29.87 | 15.38 | -26.30 | 0.9042 | -0.4788 | |||
| MS / Morgan Stanley | 0.13 | 14.83 | 0.8719 | 0.8719 | |||||
| FOXA / Fox Corporation | 0.29 | 14.64 | 0.8602 | 0.8602 | |||||
| MRNA / Moderna, Inc. | 0.51 | 14.44 | 0.8489 | 0.8489 | |||||
| JXN / Jackson Financial Inc. | 0.18 | 3.00 | 13.96 | -14.85 | 0.8208 | -0.2658 | |||
| PANW / Palo Alto Networks, Inc. | 0.07 | 570.90 | 13.90 | 580.19 | 0.8171 | 0.6817 | |||
| GILD / Gilead Sciences, Inc. | 0.13 | -34.28 | 13.81 | -27.97 | 0.8119 | -0.4587 | |||
| LNG / Cheniere Energy, Inc. | 0.06 | 38.27 | 13.31 | 42.88 | 0.7822 | 0.1651 | |||
| NTRS / Northern Trust Corporation | 0.14 | 8.94 | 13.08 | -8.82 | 0.7687 | -0.1817 | |||
| WELL / Welltower Inc. | 0.09 | 13.05 | 0.7669 | 0.7669 | |||||
| DUK / Duke Energy Corporation | 0.10 | 189.48 | 12.77 | 215.46 | 0.7505 | 0.4823 | |||
| DASH / DoorDash, Inc. | 0.06 | 107.94 | 12.47 | 112.42 | 0.7327 | 0.3438 | |||
| SN / SharkNinja, Inc. | 0.15 | 2.21 | 12.25 | -26.41 | 0.7197 | -0.3828 | |||
| COR / Cencora, Inc. | 0.04 | 2.36 | 11.93 | 17.85 | 0.7013 | 0.0305 | |||
| EL / The Estée Lauder Companies Inc. | 0.19 | 11.48 | 0.6750 | 0.6750 | |||||
| SWKS / Skyworks Solutions, Inc. | 0.18 | 11.47 | 0.6740 | 0.6740 | |||||
| PAYC / Paycom Software, Inc. | 0.05 | 2.51 | 11.25 | 11.81 | 0.6614 | -0.0054 | |||
| FIVE / Five Below, Inc. | 0.14 | 4,309.02 | 10.98 | 1,621.16 | 0.6454 | 0.5013 | |||
| DLTR / Dollar Tree, Inc. | 0.13 | 10.91 | 0.6415 | 0.6415 | |||||
| CART / Maplebear Inc. | 0.27 | 20.97 | 10.64 | -0.06 | 0.6256 | -0.0800 | |||
| ALGN / Align Technology, Inc. | 0.06 | 10.64 | 0.6255 | 0.6255 | |||||
| TMUS / T-Mobile US, Inc. | 0.04 | 1,593.09 | 10.53 | 2,499.26 | 0.6188 | 0.5611 | |||
| ANET / Arista Networks Inc | 0.13 | -22.99 | 10.50 | -45.02 | 0.6169 | -0.6479 | |||
| UAL / United Airlines Holdings, Inc. | 0.15 | 164.01 | 10.08 | 419.16 | 0.5926 | 0.2550 | |||
| SFM / Sprouts Farmers Market, Inc. | 0.06 | 2.05 | 9.81 | 10.22 | 0.5768 | -0.0132 | |||
| DELL / Dell Technologies Inc. | 0.11 | 176.48 | 9.81 | 144.88 | 0.5766 | 0.3112 | |||
| TT / Trane Technologies plc | 0.02 | 60.21 | 9.46 | 69.30 | 0.5563 | 0.1859 | |||
| MCHP / Microchip Technology Incorporated | 0.19 | 1,442.36 | 8.97 | 657.13 | 0.5273 | 0.3381 | |||
| EIX / Edison International | 0.16 | 163.08 | 8.81 | 160.73 | 0.5178 | 0.2939 | |||
| SYF / Synchrony Financial | 0.17 | 8.77 | 0.5155 | 0.5155 | |||||
| NEM / Newmont Corporation | 0.17 | 200.01 | 8.75 | 270.06 | 0.5144 | 0.3577 | |||
| CL / Colgate-Palmolive Company | 0.09 | -16.10 | 8.75 | -10.79 | 0.5141 | -0.1355 | |||
| BRBR / BellRing Brands, Inc. | 0.11 | 1.39 | 8.72 | 1.11 | 0.5127 | -0.0589 | |||
| GSCE / GS Connect S&P GSCI Enhanced Commodity Total Return ETN | 0.02 | 8.59 | 0.5049 | 0.5049 | |||||
| ILMN / Illumina, Inc. | 0.11 | 136.29 | 8.55 | 38.13 | 0.5023 | 0.0924 | |||
| TJX / The TJX Companies, Inc. | 0.07 | -19.67 | 8.46 | -17.16 | 0.4970 | -0.1793 | |||
| EOG / EOG Resources, Inc. | 0.07 | 60.60 | 8.26 | 40.87 | 0.4854 | 0.0970 | |||
| REGN / Regeneron Pharmaceuticals, Inc. | 0.01 | 204.49 | 8.08 | 170.96 | 0.4749 | 0.2773 | |||
| CAH / Cardinal Health, Inc. | 0.06 | 118.27 | 8.00 | 149.38 | 0.4700 | 0.2575 | |||
| IBKR / Interactive Brokers Group, Inc. | 0.05 | -2.23 | 7.90 | -22.73 | 0.4641 | -0.2129 | |||
| KRC / Kilroy Realty Corporation | 0.24 | 2.43 | 7.61 | -17.28 | 0.4475 | -0.1624 | |||
| MCD / McDonald's Corporation | 0.02 | 141.78 | 7.55 | 183.11 | 0.4435 | 0.1175 | |||
| EBAY / eBay Inc. | 0.11 | 1.99 | 7.53 | 3.02 | 0.4428 | -0.0417 | |||
| AMD / Advanced Micro Devices, Inc. | 0.08 | 76.44 | 7.43 | 48.15 | 0.4366 | 0.1044 | |||
| JPM / JPMorgan Chase & Co. | 0.03 | 2.45 | 7.42 | 30.71 | 0.4358 | -0.2578 | |||
| KMB / Kimberly-Clark Corporation | 0.06 | -3.06 | 7.37 | -1.71 | 0.4331 | -0.0636 | |||
| NTAP / NetApp, Inc. | 0.08 | 34.93 | 7.22 | -0.82 | 0.4241 | -0.0579 | |||
| GE / General Electric Company | 0.04 | 75.79 | 7.17 | 74.04 | 0.4217 | 0.1486 | |||
| VRSK / Verisk Analytics, Inc. | 0.02 | 3.34 | 7.14 | 6.57 | 0.4195 | -0.0242 | |||
| LMT / Lockheed Martin Corporation | 0.01 | 63.40 | 7.07 | 68.63 | 0.4158 | 0.1378 | |||
| ALSN / Allison Transmission Holdings, Inc. | 0.07 | 2.70 | 6.84 | -19.41 | 0.4022 | -0.1603 | |||
| EXPE / Expedia Group, Inc. | 0.04 | 3.14 | 6.79 | -5.32 | 0.3994 | -0.0761 | |||
| PLTR / Palantir Technologies Inc. | 0.06 | -41.01 | 6.52 | -15.30 | 0.3834 | -0.1268 | |||
| EMR / Emerson Electric Co. | 0.06 | 532.57 | 6.39 | 514.53 | 0.3753 | 0.2892 | |||
| KR / The Kroger Co. | 0.08 | 11.21 | 6.11 | 30.29 | 0.3593 | 0.0484 | |||
| GM / General Motors Company | 0.13 | 19.15 | 6.08 | 8.98 | 0.3575 | -0.0123 | |||
| ULTA / Ulta Beauty, Inc. | 0.02 | 554.83 | 6.01 | 528.80 | 0.3530 | 0.2897 | |||
| VRTX / Vertex Pharmaceuticals Incorporated | 0.01 | 12.80 | 5.85 | 24.48 | 0.3440 | 0.0325 | |||
| RBLX / Roblox Corporation | 0.09 | -32.66 | 5.83 | -36.47 | 0.3427 | -0.2654 | |||
| DECK / Deckers Outdoor Corporation | 0.05 | 5.81 | 0.3416 | 0.3416 | |||||
| NOW / ServiceNow, Inc. | 0.01 | -33.06 | 5.69 | -37.23 | 0.3343 | -0.2661 | |||
| CRH / CRH plc | 0.06 | -56.05 | 5.59 | -57.66 | 0.3284 | -0.5457 | |||
| ZM / Zoom Communications Inc. | 0.07 | -14.13 | 5.22 | -23.42 | 0.3070 | -0.1449 | |||
| MA / Mastercard Incorporated | 0.01 | -62.02 | 4.99 | -62.53 | 0.2933 | -0.5890 | |||
| FMC / FMC Corporation | 0.12 | 42.56 | 4.86 | 7.13 | 0.2855 | -0.0149 | |||
| WM / Waste Management, Inc. | 0.02 | 0.00 | 4.78 | 5.97 | 0.2808 | -0.0180 | |||
| TRGP / Targa Resources Corp. | 0.03 | 2.15 | 4.75 | -11.31 | 0.2790 | -0.0756 | |||
| INCY / Incyte Corporation | 0.08 | 3.69 | 4.74 | -12.41 | 0.2785 | -0.0798 | |||
| SPG / Simon Property Group, Inc. | 0.03 | 154.55 | 4.68 | 130.43 | 0.2751 | 0.1405 | |||
| AMAT / Applied Materials, Inc. | 0.03 | -1.04 | 4.65 | -17.31 | 0.2735 | -0.0994 | |||
| AEP / American Electric Power Company, Inc. | 0.04 | 1,384.61 | 4.61 | 1,728.57 | 0.2708 | 0.2138 | |||
| ON / ON Semiconductor Corporation | 0.12 | -1.82 | 4.57 | -25.53 | 0.2687 | -0.1380 | |||
| VTR / Ventas, Inc. | 0.06 | 220.83 | 4.52 | 272.18 | 0.2658 | 0.1853 | |||
| HIG / The Hartford Insurance Group, Inc. | 0.04 | 1.45 | 4.31 | 11.54 | 0.2534 | -0.0027 | |||
| CARG / CarGurus, Inc. | 0.15 | 4.30 | 4.23 | -25.60 | 0.2486 | -0.1281 | |||
| HUM / Humana Inc. | 0.02 | 3.15 | 4.16 | -7.76 | 0.2445 | -0.0543 | |||
| BAH / Booz Allen Hamilton Holding Corporation | 0.03 | 3.45 | 4.13 | -3.76 | 0.2425 | -0.0415 | |||
| ACGL / Arch Capital Group Ltd. | 0.04 | 33.46 | 4.02 | 30.02 | 0.2366 | 0.0315 | |||
| WFRD / Weatherford International plc | 0.10 | 91.02 | 4.01 | 25.63 | 0.2357 | 0.0242 | |||
| RTX / RTX Corporation | 0.03 | 1.01 | 3.93 | -1.21 | 0.2312 | -0.0326 | |||
| MMM / 3M Company | 0.03 | 0.00 | 3.77 | -8.72 | 0.2214 | -0.0521 | |||
| ORLY / O'Reilly Automotive, Inc. | 0.00 | 21.08 | 3.76 | 32.41 | 0.2212 | 0.0328 | |||
| CRL / Charles River Laboratories International, Inc. | 0.03 | 3,015.89 | 3.72 | 1,646.95 | 0.2188 | 0.1692 | |||
| V / Visa Inc. | 0.01 | 18.22 | 3.68 | 19.50 | 0.2165 | 0.0123 | |||
| SCCO / Southern Copper Corporation | 0.04 | 24.75 | 3.66 | 21.88 | 0.2152 | 0.0162 | |||
| MPC / Marathon Petroleum Corporation | 0.03 | -20.37 | 3.61 | -24.90 | 0.2122 | -0.1063 | |||
| BRK.B / Berkshire Hathaway Inc. | 0.01 | -76.27 | 3.58 | -73.01 | 0.2105 | -0.6685 | |||
| WAY / Waystar Holding Corp. | 0.09 | 3.53 | 0.2073 | 0.2073 | |||||
| RCL / Royal Caribbean Cruises Ltd. | 0.02 | 1.24 | 3.50 | -18.40 | 0.2060 | -0.0785 | |||
| EXC / Exelon Corporation | 0.07 | 355.03 | 3.48 | 448.58 | 0.2045 | 0.0942 | |||
| DUOL / Duolingo, Inc. | 0.01 | 1.22 | 3.42 | 8.32 | 0.2012 | -0.0082 | |||
| CNC / Centene Corporation | 0.06 | 86.57 | 3.39 | 74.38 | 0.1993 | 0.0705 | |||
| PEGA / Pegasystems Inc. | 0.04 | 2.22 | 3.38 | -13.08 | 0.1989 | -0.0590 | |||
| MRK / Merck & Co., Inc. | 0.04 | -57.39 | 3.25 | -63.27 | 0.1913 | -0.3957 | |||
| EA / Electronic Arts Inc. | 0.02 | 1.21 | 3.24 | 19.46 | 0.1905 | 0.0108 | |||
| PBF / PBF Energy Inc. | 0.18 | 296.43 | 3.15 | 1,364.19 | 0.1850 | 0.1226 | |||
| LII / Lennox International Inc. | 0.01 | 4.29 | 3.09 | -3.73 | 0.1818 | -0.0311 | |||
| EPAM / EPAM Systems, Inc. | 0.02 | 40.90 | 2.97 | -53.57 | 0.1744 | -1.1510 | |||
| MAS / Masco Corporation | 0.05 | 2.27 | 2.97 | -21.80 | 0.1743 | -0.0770 | |||
| TEAM / Atlassian Corporation | 0.01 | 2.96 | 0.1737 | 0.1737 | |||||
| MRVL / Marvell Technology, Inc. | 0.05 | 2.90 | 0.1705 | 0.1705 | |||||
| ATMU / Atmus Filtration Technologies Inc. | 0.08 | 3.51 | 2.80 | -14.18 | 0.1643 | -0.0515 | |||
| ENPH / Enphase Energy, Inc. | 0.06 | 13.97 | 2.79 | -36.15 | 0.1641 | -0.5956 | |||
| KNF / Knife River Corporation | 0.03 | 4.76 | 2.78 | -5.55 | 0.1632 | -0.0316 | |||
| GL / Globe Life Inc. | 0.02 | 2.91 | 2.64 | 3.97 | 0.1554 | -0.0131 | |||
| NFLX / Netflix, Inc. | 0.00 | 0.00 | 2.60 | 15.86 | 0.1529 | 0.0041 | |||
| CME / CME Group Inc. | 0.01 | 2.56 | 0.1506 | 0.1506 | |||||
| QRVO / Qorvo, Inc. | 0.04 | 450.22 | 2.53 | 454.49 | 0.1489 | 0.1110 | |||
| SNX / TD SYNNEX Corporation | 0.02 | 0.00 | 2.49 | -22.27 | 0.1461 | -0.0657 | |||
| PVH / PVH Corp. | 0.04 | 2.77 | 2.44 | -20.86 | 0.1434 | -0.0609 | |||
| AMT / American Tower Corporation | 0.01 | 0.00 | 2.43 | 21.89 | 0.1427 | 0.0107 | |||
| ELAN / Elanco Animal Health Incorporated | 0.25 | 4.71 | 2.42 | -17.49 | 0.1420 | -0.0520 | |||
| NOC / Northrop Grumman Corporation | 0.00 | 2.38 | 0.1397 | 0.1397 | |||||
| SLG / SL Green Realty Corp. | 0.04 | 4.57 | 2.33 | -18.35 | 0.1368 | -0.0521 | |||
| CRUS / Cirrus Logic, Inc. | 0.02 | 5.55 | 2.22 | 0.91 | 0.1303 | -0.0152 | |||
| CBOE / Cboe Global Markets, Inc. | 0.01 | 3.27 | 2.19 | 12.07 | 0.1289 | -0.0007 | |||
| LTH / Life Time Group Holdings, Inc. | 0.07 | 2.14 | 0.1255 | 0.1255 | |||||
| AZO / AutoZone, Inc. | 0.00 | 0.00 | 2.12 | 12.33 | 0.1247 | -0.0005 | |||
| JHG / Janus Henderson Group plc | 0.06 | 0.00 | 2.10 | -26.10 | 0.1237 | -0.0649 | |||
| VIRT / Virtu Financial, Inc. | 0.05 | 4.37 | 2.10 | 2.00 | 0.1232 | -0.0130 | |||
| US21871X1090 / Corebridge Financial, Inc. | 0.07 | -16.73 | 2.03 | -26.92 | 0.1190 | -0.0646 | |||
| UNH / UnitedHealth Group Incorporated | 0.00 | -46.23 | 2.02 | -60.82 | 0.1187 | -0.3079 | |||
| LLY / Eli Lilly and Company | 0.00 | -10.10 | 1.99 | -0.40 | 0.1171 | -0.0154 | |||
| SHW / The Sherwin-Williams Company | 0.01 | 1.68 | 1.92 | 0.21 | 0.1128 | -0.0141 | |||
| UNP / Union Pacific Corporation | 0.01 | -55.86 | 1.90 | -61.59 | 0.1117 | -0.2159 | |||
| SKYW / SkyWest, Inc. | 0.02 | 3.40 | 1.77 | -23.75 | 0.1038 | -0.0497 | |||
| MOS / The Mosaic Company | 0.06 | 2.06 | 1.74 | 11.24 | 0.1024 | -0.0014 | |||
| AXTA / Axalta Coating Systems Ltd. | 0.05 | 3.12 | 1.71 | -6.76 | 0.1005 | -0.0210 | |||
| CVLT / Commvault Systems, Inc. | 0.01 | 8.35 | 1.67 | 13.65 | 0.0984 | 0.0008 | |||
| ELV / Elevance Health, Inc. | 0.00 | -32.87 | 1.65 | -28.65 | 0.0971 | -0.0563 | |||
| CTAS / Cintas Corporation | 0.01 | 7.05 | 1.65 | -18.79 | 0.0971 | -0.4753 | |||
| MUSA / Murphy USA Inc. | 0.00 | 10.37 | 1.57 | 9.44 | 0.0920 | -0.0028 | |||
| CPRI / Capri Holdings Limited | 0.10 | 1.46 | 0.0856 | 0.0856 | |||||
| SO / The Southern Company | 0.02 | 1.42 | 0.0832 | 0.0832 | |||||
| BIIB / Biogen Inc. | 0.01 | 4.27 | 1.39 | -12.28 | 0.0815 | -0.0232 | |||
| STLD / Steel Dynamics, Inc. | 0.01 | 3.43 | 1.38 | 4.70 | 0.0812 | -0.0063 | |||
| ALNY / Alnylam Pharmaceuticals, Inc. | 0.01 | 3.47 | 1.36 | 0.37 | 0.0798 | -0.0098 | |||
| RYAN / Ryan Specialty Holdings, Inc. | 0.02 | 4.40 | 1.33 | 2.69 | 0.0785 | -0.0076 | |||
| SPXC / SPX Technologies, Inc. | 0.01 | 0.00 | 1.32 | -9.69 | 0.0778 | -0.0193 | |||
| DXC / DXC Technology Company | 0.08 | 4.43 | 1.31 | -25.36 | 0.0772 | -0.0394 | |||
| LDOS / Leidos Holdings, Inc. | 0.01 | 0.00 | 1.30 | 3.66 | 0.0766 | -0.0067 | |||
| MSCI / MSCI Inc. | 0.00 | 3.07 | 1.28 | -5.88 | 0.0753 | -0.0148 | |||
| ACI / Albertsons Companies, Inc. | 0.06 | 0.00 | 1.24 | 9.60 | 0.0732 | -0.0021 | |||
| IBM / International Business Machines Corporation | 0.01 | 3.65 | 1.22 | -2.00 | 0.0719 | -0.0108 | |||
| AA / Alcoa Corporation | 0.05 | 0.00 | 1.22 | -30.54 | 0.0715 | -0.0446 | |||
| MAC / The Macerich Company | 0.08 | 4.82 | 1.18 | -26.07 | 0.0694 | -0.0364 | |||
| GTM / ZoomInfo Technologies Inc. | 0.12 | 2.46 | 1.01 | -14.71 | 0.0593 | -0.0191 | |||
| TSLA / Tesla, Inc. | 0.00 | -100.00 | 0.00 | -100.00 | -0.8668 | ||||
| ACLS / Axcelis Technologies, Inc. | 0.00 | -100.00 | 0.00 | -100.00 | -0.0477 |