Basic Stats
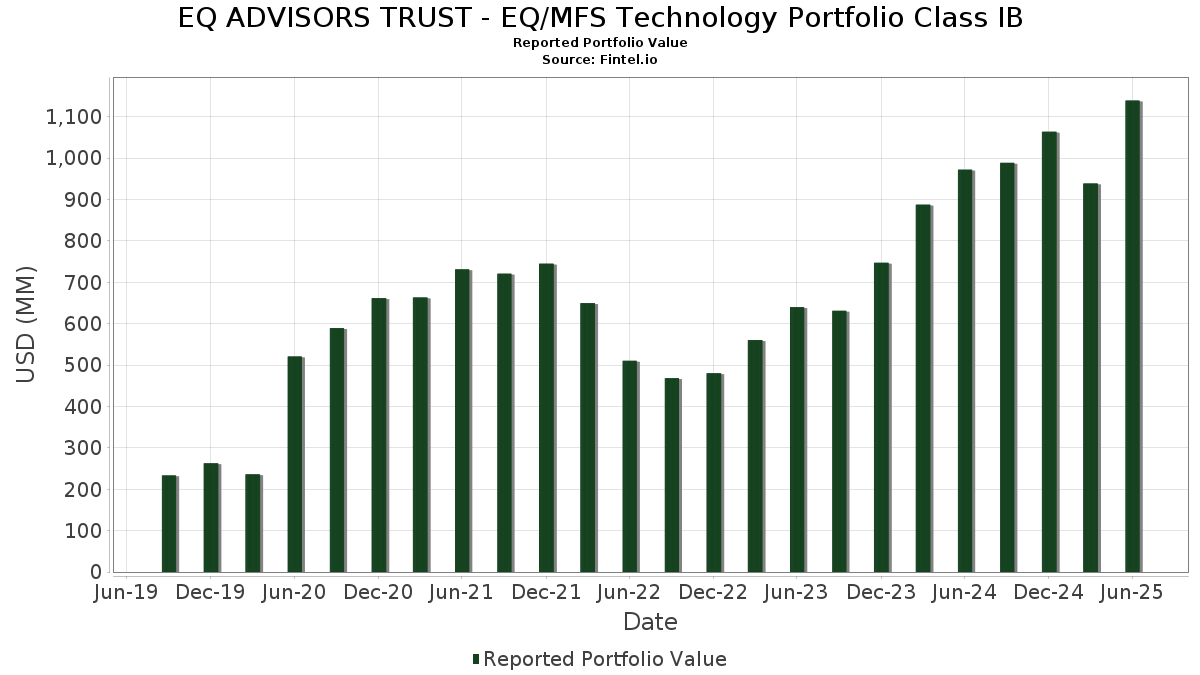
| Portfolio Value | $ 1,139,003,722 |
| Current Positions | 54 |
Latest Holdings, Performance, AUM (from 13F, 13D)
EQ ADVISORS TRUST - EQ/MFS Technology Portfolio Class IB has disclosed 54 total holdings in their latest SEC filings. Most recent portfolio value is calculated to be $ 1,139,003,722 USD. Actual Assets Under Management (AUM) is this value plus cash (which is not disclosed). EQ ADVISORS TRUST - EQ/MFS Technology Portfolio Class IB’s top holdings are Meta Platforms, Inc. (US:META) , Microsoft Corporation (US:MSFT) , NVIDIA Corporation (US:NVDA) , Alphabet Inc. (US:GOOGL) , and Apple Inc. (US:AAPL) . EQ ADVISORS TRUST - EQ/MFS Technology Portfolio Class IB’s new positions include Zscaler, Inc. (US:ZS) , CrowdStrike Holdings, Inc. (US:CRWD) , .
Top Increases This Quarter
We use the change in the portfolio allocation because this is the most meaningful metric. Changes can be due to trades or changes in share prices.
| Security | Shares (MM) |
Value (MM$) |
Portfolio % | ΔPortfolio % |
|---|---|---|---|---|
| 0.54 | 84.70 | 7.4016 | 3.1929 | |
| 0.21 | 105.21 | 9.1936 | 1.8569 | |
| 0.21 | 58.83 | 5.1413 | 1.8356 | |
| 13.31 | 13.31 | 1.1633 | 1.1633 | |
| 0.09 | 19.83 | 1.7331 | 1.1568 | |
| 0.14 | 41.75 | 3.6484 | 0.9695 | |
| 0.32 | 22.23 | 1.9425 | 0.9028 | |
| 0.19 | 137.84 | 12.0452 | 0.7919 | |
| 0.07 | 7.54 | 0.6589 | 0.6536 | |
| 0.02 | 7.20 | 0.6294 | 0.6294 |
Top Decreases This Quarter
We use the change in the portfolio allocation because this is the most meaningful metric. Changes can be due to trades or changes in share prices.
| Security | Shares (MM) |
Value (MM$) |
Portfolio % | ΔPortfolio % |
|---|---|---|---|---|
| 0.06 | 16.67 | 1.4563 | -1.8838 | |
| 0.00 | 1.36 | 0.1189 | -1.3056 | |
| 0.30 | 61.19 | 5.3469 | -1.0286 | |
| 0.00 | 0.00 | -0.8827 | ||
| 0.05 | 5.45 | 0.4759 | -0.8444 | |
| 0.14 | 13.51 | 1.1808 | -0.6454 | |
| 0.00 | 11.83 | 1.0340 | -0.5803 | |
| 0.10 | 9.80 | 0.8565 | -0.5496 | |
| 0.06 | 4.99 | 0.4358 | -0.5366 | |
| 0.08 | 24.76 | 2.1634 | -0.5355 |
13F and Fund Filings
This form was filed on 2025-08-26 for the reporting period 2025-06-30. Click the link icon to see the full transaction history.
Upgrade to unlock premium data and export to Excel ![]() .
.
| Security | Type | Avg Share Price | Shares (MM) |
ΔShares (%) |
ΔShares (%) |
Value ($MM) |
Portfolio (%) |
ΔPortfolio (%) |
|
|---|---|---|---|---|---|---|---|---|---|
| META / Meta Platforms, Inc. | 0.19 | 1.32 | 137.84 | 29.75 | 12.0452 | 0.7919 | |||
| MSFT / Microsoft Corporation | 0.21 | 14.64 | 105.21 | 51.90 | 9.1936 | 1.8569 | |||
| NVDA / NVIDIA Corporation | 0.54 | 46.24 | 84.70 | 113.18 | 7.4016 | 3.1929 | |||
| GOOGL / Alphabet Inc. | 0.47 | 2.57 | 83.70 | 16.89 | 7.3142 | -0.2710 | |||
| AAPL / Apple Inc. | 0.30 | 10.06 | 61.19 | 1.66 | 5.3469 | -1.0286 | |||
| AVGO / Broadcom Inc. | 0.21 | 14.51 | 58.83 | 88.53 | 5.1413 | 1.8356 | |||
| IBM / International Business Machines Corporation | 0.14 | 39.26 | 41.75 | 65.09 | 3.6484 | 0.9695 | |||
| ORCL / Oracle Corporation | 0.14 | -34.05 | 30.17 | 3.14 | 2.6360 | -0.4621 | |||
| SHOP / Shopify Inc. | 0.26 | 28.67 | 29.97 | 55.45 | 2.6194 | 0.5768 | |||
| NOW / ServiceNow, Inc. | 0.03 | -7.74 | 25.76 | 19.14 | 2.2511 | -0.0393 | |||
| ACN / Accenture plc | 0.08 | 1.44 | 24.76 | -2.83 | 2.1634 | -0.5355 | |||
| CSCO / Cisco Systems, Inc. | 0.32 | 101.43 | 22.23 | 126.48 | 1.9425 | 0.9028 | |||
| SNOW / Snowflake Inc. | 0.09 | 138.11 | 19.83 | 264.56 | 1.7331 | 1.1568 | |||
| HIA1 / Hitachi, Ltd. | 0.68 | 16.93 | 19.75 | 48.10 | 1.7257 | 0.3132 | |||
| DOCU / DocuSign, Inc. | 0.25 | 33.62 | 19.51 | 27.86 | 1.7049 | 0.0885 | |||
| INTU / Intuit Inc. | 0.02 | 1.39 | 18.10 | 30.06 | 1.5819 | 0.1076 | |||
| DDOG / Datadog, Inc. | 0.13 | 1.32 | 17.11 | 37.19 | 1.4954 | 0.1740 | |||
| CRM / Salesforce, Inc. | 0.06 | -47.99 | 16.67 | -47.15 | 1.4563 | -1.8838 | |||
| DSGX / The Descartes Systems Group Inc. | 0.16 | 1.44 | 15.89 | 2.36 | 1.3884 | -0.2558 | |||
| GWRE / Guidewire Software, Inc. | 0.07 | -30.04 | 15.36 | -12.08 | 1.3423 | -0.5084 | |||
| 2330 / Taiwan Semiconductor Manufacturing Company Limited | 0.41 | 10.46 | 14.95 | 46.24 | 1.3064 | 0.2235 | |||
| FDS / FactSet Research Systems Inc. | 0.03 | 106.53 | 14.84 | 103.19 | 1.2969 | 0.5232 | |||
| HUBS / HubSpot, Inc. | 0.03 | 25.99 | 14.82 | 22.77 | 1.2950 | 0.0162 | |||
| OKTA / Okta, Inc. | 0.14 | -17.51 | 13.51 | -21.62 | 1.1808 | -0.6454 | |||
| PLTR / Palantir Technologies Inc. | 0.10 | -37.75 | 13.47 | 12.20 | 1.1770 | 0.0541 | |||
| JPMorgan Prime Money Market Fund, IM Shares / STIV (N/A) | 13.31 | 13.31 | 1.1633 | 1.1633 | |||||
| TYL / Tyler Technologies, Inc. | 0.02 | 64.80 | 12.24 | 68.05 | 1.0695 | 0.2981 | |||
| EPAM / EPAM Systems, Inc. | 0.07 | 11.15 | 12.14 | 16.41 | 1.0607 | -0.0439 | |||
| TEAM / Atlassian Corporation | 0.06 | 65.41 | 12.11 | 58.32 | 1.0585 | 0.2480 | |||
| CNSWF / Constellation Software Inc. | 0.00 | -32.94 | 11.83 | -22.36 | 1.0340 | -0.5803 | |||
| AMZN / Amazon.com, Inc. | 0.05 | 28.03 | 10.98 | 47.64 | 0.9595 | 0.1716 | |||
| SPGI / S&P Global Inc. | 0.02 | 46.69 | 10.64 | 52.23 | 0.9299 | 0.1894 | |||
| VRSK / Verisk Analytics, Inc. | 0.03 | -18.71 | 10.24 | -14.92 | 0.8948 | -0.3800 | |||
| APH / Amphenol Corporation | 0.10 | -50.96 | 9.80 | -26.16 | 0.8565 | -0.5496 | |||
| ADI / Analog Devices, Inc. | 0.04 | 1.44 | 9.76 | 19.72 | 0.8532 | -0.0107 | |||
| CDNS / Cadence Design Systems, Inc. | 0.03 | -35.19 | 9.52 | -21.49 | 0.8323 | -0.4526 | |||
| AMAT / Applied Materials, Inc. | 0.04 | 1.44 | 7.97 | 27.97 | 0.6965 | 0.0367 | |||
| LRCX / Lam Research Corporation | 0.08 | 1.57 | 7.80 | 35.98 | 0.6813 | 0.0740 | |||
| TTAN / ServiceTitan, Inc. | 0.07 | 13,428.27 | 7.54 | 15,285.71 | 0.6589 | 0.6536 | |||
| ZS / Zscaler, Inc. | 0.02 | 7.20 | 0.6294 | 0.6294 | |||||
| KLAC / KLA Corporation | 0.01 | 1.31 | 7.18 | 33.50 | 0.6275 | 0.0577 | |||
| CRWD / CrowdStrike Holdings, Inc. | 0.01 | 6.15 | 0.5378 | 0.5378 | |||||
| PANW / Palo Alto Networks, Inc. | 0.03 | 6.06 | 0.5295 | 0.5295 | |||||
| AON / Aon plc | 0.02 | 22.93 | 5.86 | 9.90 | 0.5122 | -0.0528 | |||
| ANET / Arista Networks Inc | 0.05 | -66.91 | 5.45 | -56.31 | 0.4759 | -0.8444 | |||
| CDW / CDW Corporation | 0.03 | 1.44 | 5.38 | 13.03 | 0.4699 | -0.0340 | |||
| BKNG / Booking Holdings Inc. | 0.00 | -17.06 | 5.35 | 4.23 | 0.4674 | -0.0762 | |||
| MRVL / Marvell Technology, Inc. | 0.06 | -56.78 | 4.99 | -45.68 | 0.4358 | -0.5366 | |||
| TER / Teradyne, Inc. | 0.05 | 0.90 | 4.59 | 9.83 | 0.4012 | -0.0416 | |||
| MTSI / MACOM Technology Solutions Holdings, Inc. | 0.03 | -59.25 | 4.18 | -41.83 | 0.3654 | -0.3961 | |||
| TTWO / Take-Two Interactive Software, Inc. | 0.01 | 3.36 | 0.2939 | 0.2939 | |||||
| ONTO / Onto Innovation Inc. | 0.03 | 1.51 | 3.27 | -15.55 | 0.2858 | -0.1245 | |||
| S / SentinelOne, Inc. | 0.15 | 0.86 | 2.80 | 1.41 | 0.2451 | -0.0479 | |||
| IT / Gartner, Inc. | 0.00 | -89.50 | 1.36 | -89.89 | 0.1189 | -1.3056 | |||
| ESTC / Elastic N.V. | 0.00 | -100.00 | 0.00 | -100.00 | -0.8827 | ||||
| ADBE / Adobe Inc. | 0.00 | -100.00 | 0.00 | -100.00 | -0.3066 | ||||
| CA21037X1345 / CONSTELLATION SOFTWARE INC | 0.00 | 0.00 | 0.00 | 0.0000 | 0.0000 |