Basic Stats
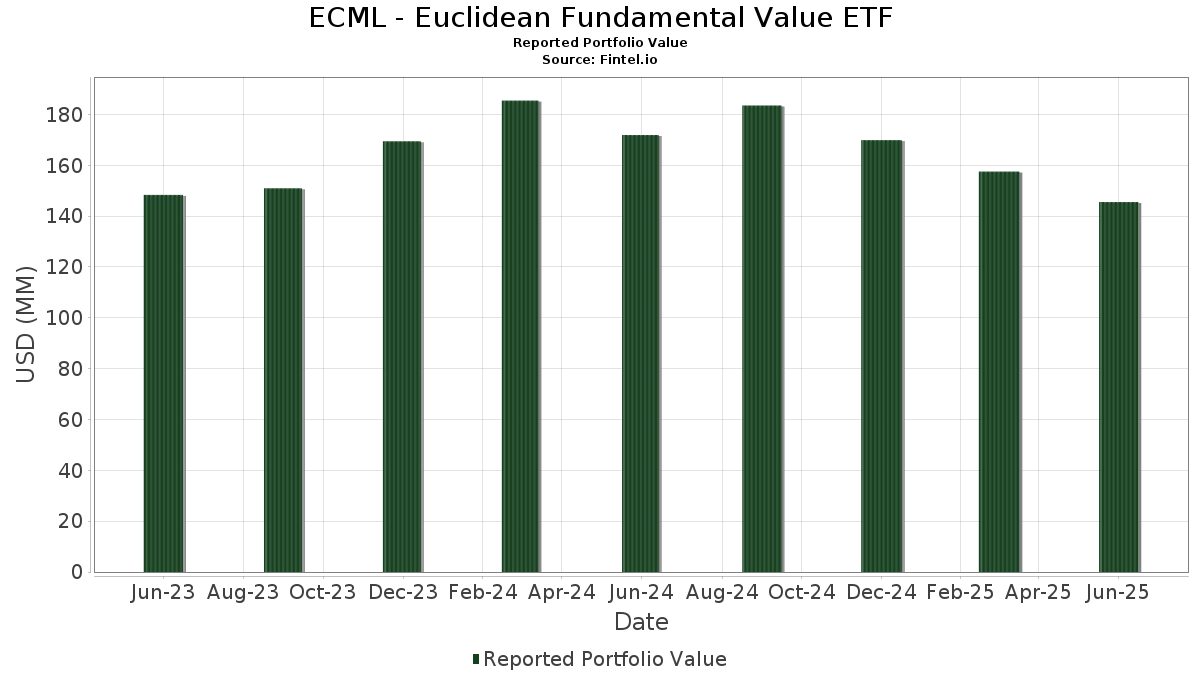
| Portfolio Value | $ 145,532,428 |
| Current Positions | 64 |
Latest Holdings, Performance, AUM (from 13F, 13D)
ECML - Euclidean Fundamental Value ETF has disclosed 64 total holdings in their latest SEC filings. Most recent portfolio value is calculated to be $ 145,532,428 USD. Actual Assets Under Management (AUM) is this value plus cash (which is not disclosed). ECML - Euclidean Fundamental Value ETF’s top holdings are Perdoceo Education Corporation (US:PRDO) , Heidrick & Struggles International, Inc. (US:HSII) , Fox Corporation (US:FOXA) , Sanmina Corporation (US:SANM) , and Group 1 Automotive, Inc. (US:GPI) . ECML - Euclidean Fundamental Value ETF’s new positions include Visteon Corporation (US:VC) , Laureate Education, Inc. (US:LAUR) , Boyd Gaming Corporation (US:BYD) , Pediatrix Medical Group, Inc. (US:MD) , and Gibraltar Industries, Inc. (US:ROCK) .
Top Increases This Quarter
We use the change in the portfolio allocation because this is the most meaningful metric. Changes can be due to trades or changes in share prices.
| Security | Shares (MM) |
Value (MM$) |
Portfolio % | ΔPortfolio % |
|---|---|---|---|---|
| 0.03 | 2.62 | 1.8000 | 1.8000 | |
| 0.11 | 2.60 | 1.7800 | 1.7800 | |
| 0.03 | 2.53 | 1.7400 | 1.7400 | |
| 0.18 | 2.52 | 1.7300 | 1.7300 | |
| 0.04 | 2.51 | 1.7300 | 1.7300 | |
| 0.12 | 2.34 | 1.6100 | 1.6100 | |
| 0.02 | 2.32 | 1.6000 | 1.6000 | |
| 0.04 | 2.31 | 1.5900 | 1.5900 | |
| 0.01 | 2.30 | 1.5800 | 1.5800 | |
| 0.03 | 2.26 | 1.5500 | 1.5500 |
Top Decreases This Quarter
We use the change in the portfolio allocation because this is the most meaningful metric. Changes can be due to trades or changes in share prices.
| Security | Shares (MM) |
Value (MM$) |
Portfolio % | ΔPortfolio % |
|---|---|---|---|---|
| 0.00 | 0.00 | -1.7200 | ||
| 0.00 | 0.00 | -1.3800 | ||
| 0.03 | 1.55 | 1.0700 | -0.7000 | |
| 0.06 | 2.59 | 1.7800 | -0.6500 | |
| 0.02 | 1.55 | 1.0700 | -0.6400 | |
| 0.01 | 1.53 | 1.0500 | -0.4900 | |
| 0.03 | 1.45 | 1.0000 | -0.4400 | |
| 0.05 | 1.50 | 1.0300 | -0.3800 | |
| 0.09 | 2.08 | 1.4300 | -0.3100 | |
| 0.02 | 1.44 | 0.9900 | -0.3100 |
13F and Fund Filings
This form was filed on 2025-08-29 for the reporting period 2025-06-30. Click the link icon to see the full transaction history.
Upgrade to unlock premium data and export to Excel ![]() .
.
| Security | Type | Avg Share Price | Shares (MM) |
ΔShares (%) |
ΔShares (%) |
Value ($MM) |
Portfolio (%) |
ΔPortfolio (%) |
|
|---|---|---|---|---|---|---|---|---|---|
| PRDO / Perdoceo Education Corporation | 0.11 | -7.39 | 3.75 | 20.25 | 2.5800 | 0.6000 | |||
| HSII / Heidrick & Struggles International, Inc. | 0.08 | -7.38 | 3.60 | -1.04 | 2.4800 | 0.1700 | |||
| FOXA / Fox Corporation | 0.06 | -12.13 | 3.56 | -12.99 | 2.4500 | -0.1500 | |||
| SANM / Sanmina Corporation | 0.04 | -7.37 | 3.51 | 18.97 | 2.4100 | 0.5400 | |||
| GPI / Group 1 Automotive, Inc. | 0.01 | -7.28 | 3.38 | 6.02 | 2.3300 | 0.3000 | |||
| MLI / Mueller Industries, Inc. | 0.04 | -7.36 | 3.35 | -3.29 | 2.3000 | 0.1000 | |||
| CALM / Cal-Maine Foods, Inc. | 0.03 | -21.51 | 3.32 | -13.98 | 2.2800 | -0.1700 | |||
| ALSN / Allison Transmission Holdings, Inc. | 0.03 | -7.30 | 3.03 | -7.95 | 2.0800 | -0.0100 | |||
| MO / Altria Group, Inc. | 0.05 | -7.37 | 3.00 | -9.51 | 2.0600 | -0.0400 | |||
| OSK / Oshkosh Corporation | 0.03 | -7.30 | 2.96 | 11.90 | 2.0400 | 0.3600 | |||
| INGR / Ingredion Incorporated | 0.02 | -7.32 | 2.87 | -7.06 | 1.9700 | 0.0100 | |||
| DDS / Dillard's, Inc. | 0.01 | -7.37 | 2.79 | 8.09 | 1.9200 | 0.2800 | |||
| CF / CF Industries Holdings, Inc. | 0.03 | -7.38 | 2.72 | 9.03 | 1.8700 | 0.2900 | |||
| FCX / Freeport-McMoRan Inc. | 0.06 | -7.36 | 2.66 | 6.07 | 1.8300 | 0.2400 | |||
| VC / Visteon Corporation | 0.03 | 2.62 | 1.8000 | 1.8000 | |||||
| LAUR / Laureate Education, Inc. | 0.11 | 2.60 | 1.7800 | 1.7800 | |||||
| PPC / Pilgrim's Pride Corporation | 0.06 | -18.15 | 2.59 | -32.46 | 1.7800 | -0.6500 | |||
| MOH / Molina Healthcare, Inc. | 0.01 | -7.34 | 2.57 | -16.22 | 1.7700 | -0.1800 | |||
| BYD / Boyd Gaming Corporation | 0.03 | 2.53 | 1.7400 | 1.7400 | |||||
| MD / Pediatrix Medical Group, Inc. | 0.18 | 2.52 | 1.7300 | 1.7300 | |||||
| ROCK / Gibraltar Industries, Inc. | 0.04 | 2.51 | 1.7300 | 1.7300 | |||||
| LNG / Cheniere Energy, Inc. | 0.01 | -7.16 | 2.40 | -2.32 | 1.6500 | 0.0900 | |||
| HESM / Hess Midstream LP | 0.06 | -7.38 | 2.35 | -15.66 | 1.6200 | -0.1500 | |||
| TGNA / TEGNA Inc. | 0.14 | -7.38 | 2.35 | -14.79 | 1.6100 | -0.1400 | |||
| PAGP / Plains GP Holdings, L.P. - Limited Partnership | 0.12 | 2.34 | 1.6100 | 1.6100 | |||||
| CQP / Cheniere Energy Partners, L.P. - Limited Partnership | 0.04 | -7.38 | 2.33 | -21.39 | 1.6000 | -0.2800 | |||
| MATX / Matson, Inc. | 0.02 | 2.32 | 1.6000 | 1.6000 | |||||
| NEM / Newmont Corporation | 0.04 | 2.31 | 1.5900 | 1.5900 | |||||
| UHS / Universal Health Services, Inc. | 0.01 | 2.30 | 1.5800 | 1.5800 | |||||
| LPX / Louisiana-Pacific Corporation | 0.03 | 2.26 | 1.5500 | 1.5500 | |||||
| CMC / Commercial Metals Company | 0.05 | -7.35 | 2.25 | -1.49 | 1.5500 | 0.1000 | |||
| PCAR / PACCAR Inc | 0.02 | -7.30 | 2.25 | -9.53 | 1.5500 | -0.0300 | |||
| IPG / The Interpublic Group of Companies, Inc. | 0.09 | 2.19 | 1.5100 | 1.5100 | |||||
| COP / ConocoPhillips | 0.02 | -7.29 | 2.17 | -20.80 | 1.4900 | -0.2500 | |||
| SHOO / Steven Madden, Ltd. | 0.09 | 2.17 | 1.4900 | 1.4900 | |||||
| CROX / Crocs, Inc. | 0.02 | 2.15 | 1.4800 | 1.4800 | |||||
| EOG / EOG Resources, Inc. | 0.02 | -7.28 | 2.15 | -13.53 | 1.4800 | -0.1000 | |||
| CBT / Cabot Corporation | 0.03 | 2.14 | 1.4700 | 1.4700 | |||||
| DVN / Devon Energy Corporation | 0.07 | -7.37 | 2.13 | -21.21 | 1.4600 | -0.2600 | |||
| DNOW / DNOW Inc. | 0.14 | 2.10 | 1.4400 | 1.4400 | |||||
| ATKR / Atkore Inc. | 0.03 | -7.38 | 2.08 | 8.94 | 1.4300 | 0.2100 | |||
| GIII / G-III Apparel Group, Ltd. | 0.09 | -7.38 | 2.08 | -24.15 | 1.4300 | -0.3100 | |||
| ELV / Elevance Health, Inc. | 0.01 | 2.07 | 1.4200 | 1.4200 | |||||
| HRMY / Harmony Biosciences Holdings, Inc. | 0.07 | -7.37 | 2.05 | -11.81 | 1.4100 | -0.0700 | |||
| CNC / Centene Corporation | 0.04 | 2.03 | 1.4000 | 1.4000 | |||||
| OC / Owens Corning | 0.01 | -7.27 | 2.00 | -10.68 | 1.3700 | -0.0500 | |||
| PLAB / Photronics, Inc. | 0.10 | -7.38 | 1.93 | -15.99 | 1.3300 | -0.1300 | |||
| UTHR / United Therapeutics Corporation | 0.01 | -7.38 | 1.92 | -13.68 | 1.3200 | -0.0900 | |||
| TAP / Molson Coors Beverage Company | 0.04 | 1.87 | 1.2900 | 1.2900 | |||||
| ANDE / The Andersons, Inc. | 0.05 | -7.34 | 1.87 | -20.67 | 1.2800 | -0.2200 | |||
| INSW / International Seaways, Inc. | 0.05 | -7.36 | 1.78 | 1.83 | 1.2200 | 0.1100 | |||
| TOL / Toll Brothers, Inc. | 0.01 | -27.18 | 1.65 | -21.29 | 1.1300 | -0.2000 | |||
| BCC / Boise Cascade Company | 0.02 | -7.28 | 1.55 | -17.95 | 1.0700 | -0.1300 | |||
| TMHC / Taylor Morrison Home Corporation | 0.03 | -45.45 | 1.55 | -44.21 | 1.0700 | -0.7000 | |||
| GRBK / Green Brick Partners, Inc. | 0.02 | -46.46 | 1.55 | -42.28 | 1.0700 | -0.6400 | |||
| DHI / D.R. Horton, Inc. | 0.01 | -24.94 | 1.54 | -23.87 | 1.0600 | -0.2300 | |||
| PHM / PulteGroup, Inc. | 0.01 | -38.51 | 1.53 | -36.90 | 1.0500 | -0.4900 | |||
| LEN / Lennar Corporation | 0.01 | -21.24 | 1.51 | -24.12 | 1.0400 | -0.2200 | |||
| MHO / M/I Homes, Inc. | 0.01 | -27.25 | 1.51 | -28.58 | 1.0400 | -0.3000 | |||
| TPH / Tri Pointe Homes, Inc. | 0.05 | -32.62 | 1.50 | -32.57 | 1.0300 | -0.3800 | |||
| KBH / KB Home | 0.03 | -29.95 | 1.45 | -36.16 | 1.0000 | -0.4400 | |||
| MTH / Meritage Homes Corporation | 0.02 | -25.68 | 1.44 | -29.78 | 0.9900 | -0.3100 | |||
| AMR / Alpha Metallurgical Resources, Inc. | 0.01 | 2.69 | 1.32 | -7.78 | 0.9000 | -0.0100 | |||
| FGXXX / First American Funds Inc - First American Government Obligations Fund Class X | 0.63 | 2.62 | 0.4300 | 0.0400 | |||||
| 1THC / Tenet Healthcare Corporation | 0.00 | -100.00 | 0.00 | -100.00 | -1.7200 | ||||
| MRP / Millrose Properties, Inc. | 0.00 | -100.00 | 0.00 | -100.00 | -0.1400 | ||||
| CNR / Core Natural Resources, Inc. | 0.00 | -100.00 | 0.00 | -100.00 | -1.3800 |