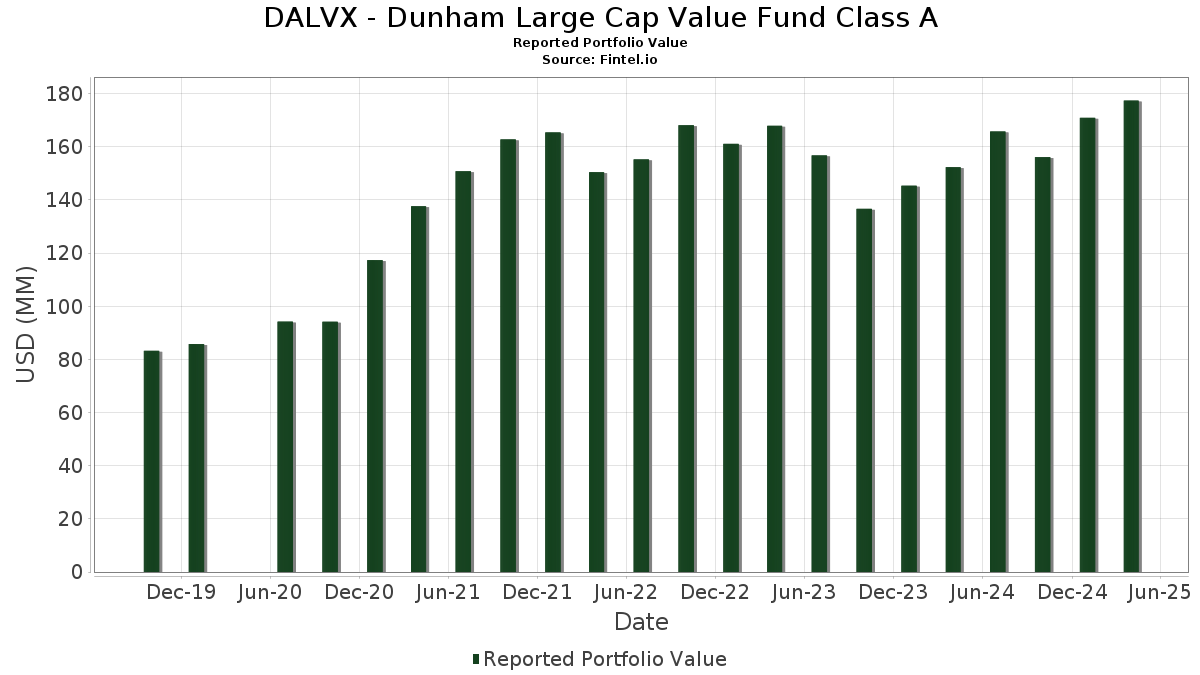
Basic Stats
| Portfolio Value | $ 177,396,052 |
| Current Positions | 77 |
Latest Holdings, Performance, AUM (from 13F, 13D)
DALVX - Dunham Large Cap Value Fund Class A has disclosed 77 total holdings in their latest SEC filings. Most recent portfolio value is calculated to be $ 177,396,052 USD. Actual Assets Under Management (AUM) is this value plus cash (which is not disclosed). DALVX - Dunham Large Cap Value Fund Class A’s top holdings are JPMorgan Chase & Co. (US:JPM) , Abbott Laboratories (US:ABT) , Invesco Treasury Portfolio, Institutional Class (US:US8252524066) , Berkshire Hathaway Inc. (US:BRK.B) , and Exxon Mobil Corporation (US:XOM) . DALVX - Dunham Large Cap Value Fund Class A’s new positions include Invesco Treasury Portfolio, Institutional Class (US:US8252524066) , GE Vernova Inc. (US:GEV) , The TJX Companies, Inc. (US:TJX) , Rockwell Automation, Inc. (US:ROK) , and .
Top Increases This Quarter
We use the change in the portfolio allocation because this is the most meaningful metric. Changes can be due to trades or changes in share prices.
| Security | Shares (MM) |
Value (MM$) |
Portfolio % | ΔPortfolio % |
|---|---|---|---|---|
| 0.01 | 2.61 | 1.4712 | 1.4712 | |
| 0.02 | 2.37 | 1.3332 | 1.3332 | |
| 0.01 | 1.95 | 1.0977 | 1.0977 | |
| 4.40 | 2.4809 | 0.8176 | ||
| 0.01 | 4.38 | 2.4711 | 0.4177 | |
| 0.01 | 2.45 | 1.3793 | 0.3095 | |
| 0.04 | 2.78 | 1.5649 | 0.3059 | |
| 0.01 | 2.48 | 1.3981 | 0.2501 | |
| 0.03 | 3.09 | 1.7408 | 0.2445 | |
| 0.01 | 0.96 | 0.5409 | 0.2428 |
Top Decreases This Quarter
We use the change in the portfolio allocation because this is the most meaningful metric. Changes can be due to trades or changes in share prices.
| Security | Shares (MM) |
Value (MM$) |
Portfolio % | ΔPortfolio % |
|---|---|---|---|---|
| 0.04 | 1.87 | 1.0526 | -0.5551 | |
| 0.01 | 3.48 | 1.9600 | -0.4832 | |
| 0.00 | 2.17 | 1.2215 | -0.4760 | |
| 0.01 | 2.33 | 1.3142 | -0.4172 | |
| 0.03 | 2.95 | 1.6626 | -0.2910 | |
| 0.06 | 0.76 | 0.4263 | -0.2648 | |
| 0.03 | 1.69 | 0.9537 | -0.2591 | |
| 0.01 | 2.00 | 1.1255 | -0.2414 | |
| 0.00 | 3.35 | 1.8873 | -0.2118 | |
| 0.01 | 3.34 | 1.8798 | -0.1971 |
13F and Fund Filings
This form was filed on 2025-06-26 for the reporting period 2025-04-30. Click the link icon to see the full transaction history.
Upgrade to unlock premium data and export to Excel ![]() .
.
| Security | Type | Avg Share Price | Shares (MM) |
ΔShares (%) |
ΔShares (%) |
Value ($MM) |
Portfolio (%) |
ΔPortfolio (%) |
|
|---|---|---|---|---|---|---|---|---|---|
| JPM / JPMorgan Chase & Co. | 0.03 | 9.83 | 6.92 | 0.51 | 3.8973 | -0.1281 | |||
| ABT / Abbott Laboratories | 0.03 | 9.83 | 4.45 | 12.25 | 2.5099 | 0.1887 | |||
| US8252524066 / Invesco Treasury Portfolio, Institutional Class | 4.40 | 54.89 | 2.4809 | 0.8176 | |||||
| BRK.B / Berkshire Hathaway Inc. | 0.01 | 9.80 | 4.38 | 24.94 | 2.4711 | 0.4177 | |||
| XOM / Exxon Mobil Corporation | 0.03 | 9.83 | 3.67 | 8.59 | 2.0657 | 0.0909 | |||
| RTX / RTX Corporation | 0.03 | 9.83 | 3.63 | 7.42 | 2.0471 | 0.0688 | |||
| BAC / Bank of America Corporation | 0.09 | 9.83 | 3.49 | -5.39 | 1.9670 | -0.1915 | |||
| WFC / Wells Fargo & Company | 0.05 | 9.83 | 3.49 | -1.02 | 1.9653 | -0.0962 | |||
| UNH / UnitedHealth Group Incorporated | 0.01 | 9.81 | 3.48 | -16.74 | 1.9600 | -0.4832 | |||
| BLK / BlackRock, Inc. | 0.00 | 9.80 | 3.35 | -6.66 | 1.8873 | -0.2118 | |||
| PH / Parker-Hannifin Corporation | 0.01 | 9.80 | 3.34 | -6.06 | 1.8798 | -0.1971 | |||
| ABBV / AbbVie Inc. | 0.02 | 9.82 | 3.23 | 16.55 | 1.8220 | 0.1985 | |||
| HIG / The Hartford Insurance Group, Inc. | 0.03 | 9.83 | 3.09 | 20.77 | 1.7408 | 0.2445 | |||
| PG / The Procter & Gamble Company | 0.02 | 9.83 | 3.08 | 7.57 | 1.7369 | 0.0605 | |||
| CSCO / Cisco Systems, Inc. | 0.05 | 9.83 | 2.97 | 4.61 | 1.6754 | 0.0131 | |||
| TRV / The Travelers Companies, Inc. | 0.01 | 9.82 | 2.96 | 18.30 | 1.6692 | 0.2045 | |||
| DIS / The Walt Disney Company | 0.03 | 9.83 | 2.95 | -11.65 | 1.6626 | -0.2910 | |||
| PWR / Quanta Services, Inc. | 0.01 | 9.81 | 2.86 | 4.46 | 1.6094 | 0.0104 | |||
| ICE / Intercontinental Exchange, Inc. | 0.02 | 9.82 | 2.84 | 15.42 | 1.5989 | 0.1607 | |||
| HON / Honeywell International Inc. | 0.01 | 9.82 | 2.82 | 3.33 | 1.5902 | -0.0074 | |||
| GILD / Gilead Sciences, Inc. | 0.03 | 9.82 | 2.79 | 20.35 | 1.5706 | 0.2161 | |||
| MDLZ / Mondelez International, Inc. | 0.04 | 9.83 | 2.78 | 29.00 | 1.5649 | 0.3059 | |||
| NEE / NextEra Energy, Inc. | 0.04 | 9.83 | 2.77 | 2.63 | 1.5589 | -0.0178 | |||
| MSI / Motorola Solutions, Inc. | 0.01 | 9.81 | 2.65 | 3.07 | 1.4943 | -0.0109 | |||
| DUK / Duke Energy Corporation | 0.02 | -6.29 | 2.65 | 2.12 | 1.4931 | -0.0251 | |||
| LOW / Lowe's Companies, Inc. | 0.01 | 9.82 | 2.65 | -5.57 | 1.4914 | -0.1484 | |||
| GEV / GE Vernova Inc. | 0.01 | 2.61 | 1.4712 | 1.4712 | |||||
| COR / Cencora, Inc. | 0.01 | 9.82 | 2.48 | 26.40 | 1.3981 | 0.2501 | |||
| AMT / American Tower Corporation | 0.01 | 9.82 | 2.45 | 33.86 | 1.3793 | 0.3095 | |||
| MLM / Martin Marietta Materials, Inc. | 0.00 | 9.82 | 2.40 | 5.74 | 1.3501 | 0.0248 | |||
| TJX / The TJX Companies, Inc. | 0.02 | 2.37 | 1.3332 | 1.3332 | |||||
| JCI / Johnson Controls International plc | 0.03 | -12.38 | 2.36 | -5.78 | 1.3326 | -0.1353 | |||
| COP / ConocoPhillips | 0.03 | 9.83 | 2.35 | -0.97 | 1.3252 | -0.0639 | |||
| TMO / Thermo Fisher Scientific Inc. | 0.01 | 9.80 | 2.33 | -21.19 | 1.3142 | -0.4172 | |||
| SPGI / S&P Global Inc. | 0.00 | 9.79 | 2.18 | 5.31 | 1.2298 | 0.0172 | |||
| LHX / L3Harris Technologies, Inc. | 0.01 | 9.82 | 2.18 | 13.98 | 1.2273 | 0.1094 | |||
| META / Meta Platforms, Inc. | 0.00 | -6.22 | 2.17 | -25.30 | 1.2215 | -0.4760 | |||
| GS / The Goldman Sachs Group, Inc. | 0.00 | 9.81 | 2.16 | -6.12 | 1.2192 | -0.1289 | |||
| DRI / Darden Restaurants, Inc. | 0.01 | 9.82 | 2.16 | 12.87 | 1.2164 | 0.0975 | |||
| BDX / Becton, Dickinson and Company | 0.01 | 9.80 | 2.13 | -8.19 | 1.2012 | -0.1566 | |||
| VZ / Verizon Communications Inc. | 0.05 | 9.83 | 2.10 | 22.89 | 1.1831 | 0.1833 | |||
| FOXA / Fox Corporation | 0.04 | 9.83 | 2.08 | 6.82 | 1.1748 | 0.0333 | |||
| MSFT / Microsoft Corporation | 0.01 | 9.80 | 2.00 | 4.55 | 1.1282 | 0.0081 | |||
| PSA / Public Storage | 0.01 | 9.81 | 2.00 | 10.55 | 1.1278 | 0.0685 | |||
| AVGO / Broadcom Inc. | 0.01 | 9.83 | 2.00 | -4.50 | 1.1259 | -0.0976 | |||
| GOOGL / Alphabet Inc. | 0.01 | 9.82 | 2.00 | -14.51 | 1.1255 | -0.2414 | |||
| ORCL / Oracle Corporation | 0.01 | 9.82 | 1.98 | -9.15 | 1.1140 | -0.1587 | |||
| CSX / CSX Corporation | 0.07 | 9.83 | 1.97 | -6.23 | 1.1116 | -0.1188 | |||
| ROK / Rockwell Automation, Inc. | 0.01 | 1.95 | 1.0977 | 1.0977 | |||||
| AXP / American Express Company | 0.01 | 9.81 | 1.92 | -7.83 | 1.0820 | -0.1369 | |||
| DAL / Delta Air Lines, Inc. | 0.04 | 9.83 | 1.87 | -32.03 | 1.0526 | -0.5551 | |||
| APD / Air Products and Chemicals, Inc. | 0.01 | 9.82 | 1.87 | -11.18 | 1.0523 | -0.1779 | |||
| EOG / EOG Resources, Inc. | 0.02 | 9.83 | 1.86 | -3.63 | 1.0472 | -0.0814 | |||
| SLB / Schlumberger Limited | 0.05 | 9.83 | 1.81 | -9.34 | 1.0176 | -0.1476 | |||
| SYK / Stryker Corporation | 0.00 | 9.82 | 1.76 | 4.95 | 0.9921 | 0.0107 | |||
| JNJ / Johnson & Johnson | 0.01 | -3.17 | 1.74 | -0.51 | 0.9821 | -0.0428 | |||
| AMGN / Amgen Inc. | 0.01 | 9.80 | 1.69 | 11.89 | 0.9552 | 0.0692 | |||
| PYPL / PayPal Holdings, Inc. | 0.03 | 9.83 | 1.69 | -18.34 | 0.9537 | -0.2591 | |||
| MRK / Merck & Co., Inc. | 0.02 | 9.83 | 1.59 | -5.29 | 0.8975 | -0.0864 | |||
| MU / Micron Technology, Inc. | 0.02 | 9.82 | 1.57 | -7.42 | 0.8869 | -0.1072 | |||
| DD / DuPont de Nemours, Inc. | 0.02 | 9.83 | 1.56 | -5.64 | 0.8774 | -0.0878 | |||
| ELS / Equity LifeStyle Properties, Inc. | 0.02 | 9.83 | 1.55 | 8.70 | 0.8739 | 0.0393 | |||
| GM / General Motors Company | 0.03 | 9.83 | 1.55 | 0.45 | 0.8724 | -0.0291 | |||
| FCX / Freeport-McMoRan Inc. | 0.04 | 9.83 | 1.51 | 10.35 | 0.8535 | 0.0508 | |||
| BK / The Bank of New York Mellon Corporation | 0.02 | 9.82 | 1.44 | 2.78 | 0.8123 | -0.0083 | |||
| OC / Owens Corning | 0.01 | 9.82 | 1.35 | -13.44 | 0.7586 | -0.1515 | |||
| CTVA / Corteva, Inc. | 0.02 | 9.82 | 1.27 | 4.37 | 0.7135 | 0.0034 | |||
| SCI / Service Corporation International | 0.02 | 9.82 | 1.25 | 12.31 | 0.7047 | 0.0534 | |||
| PRU / Prudential Financial, Inc. | 0.01 | 9.82 | 1.25 | -6.59 | 0.7030 | -0.0783 | |||
| PLD / Prologis, Inc. | 0.01 | 9.82 | 1.24 | -5.85 | 0.6990 | -0.0720 | |||
| TSN / Tyson Foods, Inc. | 0.02 | 9.83 | 1.24 | 19.15 | 0.6978 | 0.0894 | |||
| PSX / Phillips 66 | 0.01 | 9.82 | 1.14 | -3.07 | 0.6401 | -0.0453 | |||
| EXE / Expand Energy Corporation | 0.01 | 84.17 | 0.96 | 88.41 | 0.5409 | 0.2428 | |||
| AVTR / Avantor, Inc. | 0.06 | 9.83 | 0.76 | -35.99 | 0.4263 | -0.2648 | |||
| TFC / Truist Financial Corporation | 0.02 | 9.82 | 0.69 | -11.61 | 0.3907 | -0.0680 | |||
| KNX / Knight-Swift Transportation Holdings Inc. | 0.02 | 9.83 | 0.64 | -24.71 | 0.3610 | -0.1363 | |||
| ON / ON Semiconductor Corporation | 0.01 | 9.82 | 0.55 | -16.69 | 0.3094 | -0.0762 | |||
| MOUNT VERNON LIQUID ASSETS PORTFOLIO / STIV (N/A) | 0.00 | 0.00 | 0.0000 | 0.0000 |