Basic Stats
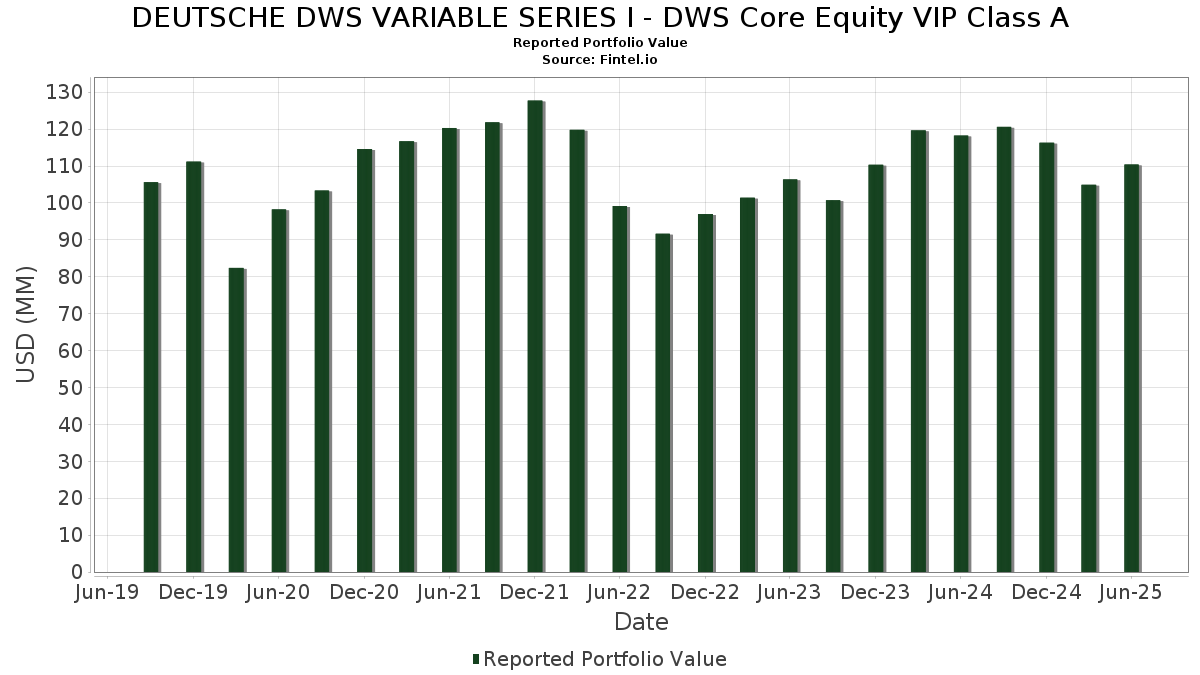
| Portfolio Value | $ 110,411,666 |
| Current Positions | 94 |
Latest Holdings, Performance, AUM (from 13F, 13D)
DEUTSCHE DWS VARIABLE SERIES I - DWS Core Equity VIP Class A has disclosed 94 total holdings in their latest SEC filings. Most recent portfolio value is calculated to be $ 110,411,666 USD. Actual Assets Under Management (AUM) is this value plus cash (which is not disclosed). DEUTSCHE DWS VARIABLE SERIES I - DWS Core Equity VIP Class A’s top holdings are Microsoft Corporation (US:MSFT) , Apple Inc. (US:AAPL) , NVIDIA Corporation (US:NVDA) , JPMorgan Chase & Co. (US:JPM) , and Amazon.com, Inc. (US:AMZN) . DEUTSCHE DWS VARIABLE SERIES I - DWS Core Equity VIP Class A’s new positions include Cboe Global Markets, Inc. (US:CBOE) , Veeva Systems Inc. (US:VEEV) , Cloudflare, Inc. (US:NET) , The TJX Companies, Inc. (US:TJX) , and Abbott Laboratories (US:ABT) .
Top Increases This Quarter
We use the change in the portfolio allocation because this is the most meaningful metric. Changes can be due to trades or changes in share prices.
| Security | Shares (MM) |
Value (MM$) |
Portfolio % | ΔPortfolio % |
|---|---|---|---|---|
| 0.02 | 10.46 | 9.5292 | 1.8145 | |
| 0.04 | 5.91 | 5.3878 | 1.1215 | |
| 0.00 | 1.11 | 1.0072 | 1.0072 | |
| 0.01 | 2.48 | 2.2613 | 0.7101 | |
| 0.00 | 0.63 | 0.5728 | 0.5728 | |
| 0.00 | 0.55 | 0.4986 | 0.4986 | |
| 0.00 | 0.53 | 0.4837 | 0.4837 | |
| 0.00 | 0.53 | 0.4815 | 0.4815 | |
| 0.00 | 0.52 | 0.4759 | 0.4759 | |
| 0.01 | 1.43 | 1.3062 | 0.4733 |
Top Decreases This Quarter
We use the change in the portfolio allocation because this is the most meaningful metric. Changes can be due to trades or changes in share prices.
| Security | Shares (MM) |
Value (MM$) |
Portfolio % | ΔPortfolio % |
|---|---|---|---|---|
| 0.04 | 8.36 | 7.6219 | -1.2302 | |
| 1.12 | 1.12 | 1.0161 | -0.7800 | |
| 0.01 | 0.97 | 0.8846 | -0.5492 | |
| 0.01 | 0.91 | 0.8267 | -0.5346 | |
| 0.00 | 0.20 | 0.1861 | -0.4972 | |
| 0.00 | 0.32 | 0.2956 | -0.4959 | |
| 0.00 | 0.40 | 0.3649 | -0.4861 | |
| 0.00 | 1.45 | 1.3194 | -0.4493 | |
| 0.62 | 0.62 | 0.5657 | -0.4391 | |
| 0.13 | 0.56 | 0.5136 | -0.4009 |
13F and Fund Filings
This form was filed on 2025-08-22 for the reporting period 2025-06-30. Click the link icon to see the full transaction history.
Upgrade to unlock premium data and export to Excel ![]() .
.
| Security | Type | Avg Share Price | Shares (MM) |
ΔShares (%) |
ΔShares (%) |
Value ($MM) |
Portfolio (%) |
ΔPortfolio (%) |
|
|---|---|---|---|---|---|---|---|---|---|
| MSFT / Microsoft Corporation | 0.02 | -2.49 | 10.46 | 29.22 | 9.5292 | 1.8145 | |||
| AAPL / Apple Inc. | 0.04 | -2.49 | 8.36 | -9.94 | 7.6219 | -1.2302 | |||
| NVDA / NVIDIA Corporation | 0.04 | -9.38 | 5.91 | 32.11 | 5.3878 | 1.1215 | |||
| JPM / JPMorgan Chase & Co. | 0.02 | -2.49 | 4.43 | 15.23 | 4.0409 | 0.3731 | |||
| AMZN / Amazon.com, Inc. | 0.02 | -2.48 | 4.01 | 12.44 | 3.6497 | 0.2544 | |||
| GOOG / Alphabet Inc. | 0.02 | -2.48 | 3.79 | 10.74 | 3.4574 | 0.1910 | |||
| META / Meta Platforms, Inc. | 0.00 | -2.48 | 3.14 | 24.86 | 2.8610 | 0.4646 | |||
| ORCL / Oracle Corporation | 0.01 | -2.48 | 2.48 | 52.49 | 2.2613 | 0.7101 | |||
| V / Visa Inc. | 0.01 | 7.54 | 2.45 | 8.95 | 2.2297 | 0.0888 | |||
| WMT / Walmart Inc. | 0.02 | -2.49 | 2.00 | 8.59 | 1.8200 | 0.0671 | |||
| ABBV / AbbVie Inc. | 0.01 | -2.49 | 1.92 | -13.58 | 1.7450 | -0.3679 | |||
| WM / Waste Management, Inc. | 0.01 | -2.49 | 1.87 | -3.60 | 1.7059 | -0.1457 | |||
| CAT / Caterpillar Inc. | 0.00 | -2.50 | 1.85 | 14.76 | 1.6859 | 0.1493 | |||
| WFC / Wells Fargo & Company | 0.02 | -2.49 | 1.66 | 8.81 | 1.5083 | 0.0585 | |||
| PHM / PulteGroup, Inc. | 0.01 | -2.48 | 1.55 | 0.06 | 1.4107 | -0.0644 | |||
| MU / Micron Technology, Inc. | 0.01 | -2.49 | 1.49 | 38.38 | 1.3573 | 0.3308 | |||
| AMP / Ameriprise Financial, Inc. | 0.00 | -29.22 | 1.45 | -21.94 | 1.3194 | -0.4493 | |||
| NRG / NRG Energy, Inc. | 0.01 | -2.48 | 1.43 | 64.15 | 1.3062 | 0.4733 | |||
| AMGN / Amgen Inc. | 0.00 | -2.48 | 1.35 | -12.63 | 1.2296 | -0.2422 | |||
| TSLA / Tesla, Inc. | 0.00 | -2.49 | 1.29 | 19.52 | 1.1775 | 0.1469 | |||
| OC / Owens Corning | 0.01 | -2.48 | 1.28 | -6.07 | 1.1704 | -0.1335 | |||
| TMUS / T-Mobile US, Inc. | 0.01 | -2.49 | 1.25 | -12.93 | 1.1415 | -0.2292 | |||
| SPF / Spotify Technology S.A. | 0.00 | -2.50 | 1.17 | 36.09 | 1.0656 | 0.2461 | |||
| DIS / The Walt Disney Company | 0.01 | -2.48 | 1.14 | 22.48 | 1.0430 | 0.1525 | |||
| US25160K3068 / DWS Central Cash Management Government Fund | 1.12 | -40.82 | 1.12 | -40.82 | 1.0161 | -0.7800 | |||
| CBOE / Cboe Global Markets, Inc. | 0.00 | 1.11 | 1.0072 | 1.0072 | |||||
| LNG / Cheniere Energy, Inc. | 0.00 | -2.49 | 1.10 | 2.62 | 1.0001 | -0.0194 | |||
| SPGI / S&P Global Inc. | 0.00 | 90.79 | 1.05 | 98.11 | 0.9552 | 0.4505 | |||
| QCOM / QUALCOMM Incorporated | 0.01 | -37.75 | 0.97 | -35.51 | 0.8846 | -0.5492 | |||
| HAS / Hasbro, Inc. | 0.01 | -2.49 | 0.93 | 17.11 | 0.8483 | 0.0903 | |||
| TAP / Molson Coors Beverage Company | 0.02 | -2.49 | 0.93 | -22.98 | 0.8436 | -0.3019 | |||
| GM / General Motors Company | 0.02 | -2.49 | 0.92 | 1.99 | 0.8410 | -0.0212 | |||
| CI / The Cigna Group | 0.00 | -2.48 | 0.91 | -2.05 | 0.8281 | -0.0560 | |||
| APO / Apollo Global Management, Inc. | 0.01 | -38.68 | 0.91 | -36.48 | 0.8267 | -0.5346 | |||
| LMT / Lockheed Martin Corporation | 0.00 | -2.49 | 0.89 | 1.03 | 0.8081 | -0.0281 | |||
| JNJ / Johnson & Johnson | 0.01 | 101.30 | 0.87 | 85.53 | 0.7952 | 0.3465 | |||
| AMD / Advanced Micro Devices, Inc. | 0.01 | -22.06 | 0.85 | -32.59 | 0.7746 | -0.2871 | |||
| COST / Costco Wholesale Corporation | 0.00 | -2.56 | 0.83 | 1.97 | 0.7559 | -0.0194 | |||
| BAC / Bank of America Corporation | 0.02 | -2.48 | 0.83 | 10.58 | 0.7530 | 0.0407 | |||
| DECK / Deckers Outdoor Corporation | 0.01 | -2.49 | 0.80 | -10.17 | 0.7332 | -0.1200 | |||
| PLD / Prologis, Inc. | 0.01 | -2.49 | 0.79 | -8.25 | 0.7199 | -0.1014 | |||
| REGN / Regeneron Pharmaceuticals, Inc. | 0.00 | -2.51 | 0.75 | -19.27 | 0.6874 | -0.2037 | |||
| US4039491000 / HF Sinclair Corp. | 0.02 | -42.73 | 0.75 | -28.50 | 0.6797 | -0.3140 | |||
| STZ / Constellation Brands, Inc. | 0.00 | -2.48 | 0.72 | -13.64 | 0.6587 | -0.1384 | |||
| CSCO / Cisco Systems, Inc. | 0.01 | -2.49 | 0.70 | 9.59 | 0.6355 | 0.0291 | |||
| BMY / Bristol-Myers Squibb Company | 0.01 | -2.48 | 0.67 | -25.97 | 0.6081 | -0.2514 | |||
| NUE / Nucor Corporation | 0.01 | -2.50 | 0.67 | 4.88 | 0.6075 | 0.0020 | |||
| SLB / Schlumberger Limited | 0.02 | 24.58 | 0.67 | 0.76 | 0.6064 | -0.0233 | |||
| Z / Zillow Group, Inc. | 0.01 | -2.48 | 0.65 | -0.46 | 0.5938 | -0.0296 | |||
| CTVA / Corteva, Inc. | 0.01 | -2.49 | 0.64 | 15.65 | 0.5860 | 0.0552 | |||
| BX / Blackstone Inc. | 0.00 | -2.48 | 0.64 | 4.23 | 0.5839 | -0.0014 | |||
| VEEV / Veeva Systems Inc. | 0.00 | 0.63 | 0.5728 | 0.5728 | |||||
| US1475396701 / DWS Gov&Agency Sec Portfolio DWS Gov Cash Inst Shs | 0.62 | -46.32 | 0.62 | -46.37 | 0.5657 | -0.4391 | |||
| ADP / Automatic Data Processing, Inc. | 0.00 | -2.49 | 0.62 | -1.60 | 0.5615 | -0.0353 | |||
| NFLX / Netflix, Inc. | 0.00 | -70.57 | 0.59 | 5.16 | 0.5393 | 0.0674 | |||
| HWM / Howmet Aerospace Inc. | 0.00 | -85.28 | 0.57 | -23.87 | 0.5212 | -0.1083 | |||
| MPW / Medical Properties Trust, Inc. | 0.13 | -17.81 | 0.56 | -41.29 | 0.5136 | -0.4009 | |||
| TTWO / Take-Two Interactive Software, Inc. | 0.00 | -47.82 | 0.56 | -38.96 | 0.5120 | -0.3641 | |||
| KKR / KKR & Co. Inc. | 0.00 | -2.49 | 0.56 | 12.20 | 0.5118 | 0.0346 | |||
| STE / STERIS plc | 0.00 | 124.78 | 0.56 | 138.03 | 0.5083 | 0.2851 | |||
| LRCX / Lam Research Corporation | 0.01 | -2.48 | 0.56 | 30.59 | 0.5062 | 0.1007 | |||
| FTNT / Fortinet, Inc. | 0.01 | -2.48 | 0.55 | 6.98 | 0.5038 | 0.0117 | |||
| ICE / Intercontinental Exchange, Inc. | 0.00 | -22.34 | 0.55 | 57.76 | 0.5004 | 0.1202 | |||
| NET / Cloudflare, Inc. | 0.00 | 0.55 | 0.4986 | 0.4986 | |||||
| WEC / WEC Energy Group, Inc. | 0.01 | -2.48 | 0.54 | -6.91 | 0.4920 | -0.0600 | |||
| TJX / The TJX Companies, Inc. | 0.00 | 0.53 | 0.4837 | 0.4837 | |||||
| AVB / AvalonBay Communities, Inc. | 0.00 | -2.52 | 0.53 | -7.53 | 0.4816 | -0.0634 | |||
| ABT / Abbott Laboratories | 0.00 | 0.53 | 0.4815 | 0.4815 | |||||
| NOW / ServiceNow, Inc. | 0.00 | 0.52 | 0.4759 | 0.4759 | |||||
| PM / Philip Morris International Inc. | 0.00 | -43.22 | 0.52 | -14.92 | 0.4736 | -0.0400 | |||
| CW / Curtiss-Wright Corporation | 0.00 | -52.09 | 0.51 | -26.26 | 0.4692 | -0.1961 | |||
| ATR / AptarGroup, Inc. | 0.00 | -2.49 | 0.51 | 2.80 | 0.4689 | -0.0082 | |||
| H / Hyatt Hotels Corporation | 0.00 | -2.49 | 0.50 | 11.06 | 0.4582 | 0.0270 | |||
| CPNG / Coupang, Inc. | 0.02 | 0.50 | 0.4552 | 0.4552 | |||||
| VRSK / Verisk Analytics, Inc. | 0.00 | -2.49 | 0.50 | 2.04 | 0.4550 | -0.0114 | |||
| GE / General Electric Company | 0.00 | -2.49 | 0.49 | 25.38 | 0.4508 | 0.0747 | |||
| DKNG / DraftKings Inc. | 0.01 | -2.49 | 0.48 | 26.18 | 0.4394 | 0.0744 | |||
| VST / Vistra Corp. | 0.00 | 0.48 | 0.4385 | 0.4385 | |||||
| MDT / Medtronic plc | 0.01 | -2.49 | 0.47 | -5.26 | 0.4265 | -0.0452 | |||
| ALL / The Allstate Corporation | 0.00 | 0.44 | 0.4043 | 0.4043 | |||||
| EL / The Estée Lauder Companies Inc. | 0.01 | -2.49 | 0.43 | 19.11 | 0.3927 | 0.0486 | |||
| CLX / The Clorox Company | 0.00 | -2.49 | 0.41 | -20.58 | 0.3735 | -0.1179 | |||
| HUM / Humana Inc. | 0.00 | -51.45 | 0.40 | -55.16 | 0.3649 | -0.4861 | |||
| MOS / The Mosaic Company | 0.01 | 11.19 | 0.37 | -15.99 | 0.3402 | -0.1455 | |||
| FE / FirstEnergy Corp. | 0.01 | -2.49 | 0.36 | -2.99 | 0.3260 | -0.0251 | |||
| XOM / Exxon Mobil Corporation | 0.00 | 0.33 | 0.2992 | 0.2992 | |||||
| ELV / Elevance Health, Inc. | 0.00 | -56.31 | 0.32 | -60.96 | 0.2956 | -0.4959 | |||
| CHRD / Chord Energy Corporation | 0.00 | 73.10 | 0.31 | 48.82 | 0.2867 | 0.0851 | |||
| VLTO / Veralto Corporation | 0.00 | -2.48 | 0.31 | 0.98 | 0.2820 | -0.0100 | |||
| MRK / Merck & Co., Inc. | 0.00 | -2.48 | 0.29 | -13.95 | 0.2643 | -0.0572 | |||
| MKSI / MKS Inc. | 0.00 | -2.48 | 0.29 | 20.76 | 0.2604 | 0.0351 | |||
| DHR / Danaher Corporation | 0.00 | -2.51 | 0.28 | -6.29 | 0.2587 | -0.0294 | |||
| BDX / Becton, Dickinson and Company | 0.00 | -62.11 | 0.20 | -71.51 | 0.1861 | -0.4972 | |||
| UNP / Union Pacific Corporation | 0.00 | -2.43 | 0.16 | -4.85 | 0.1434 | -0.0145 |