Basic Stats
| Portfolio Value | $ 103,497 |
| Current Positions | 80 |
Latest Holdings, Performance, AUM (from 13F, 13D)
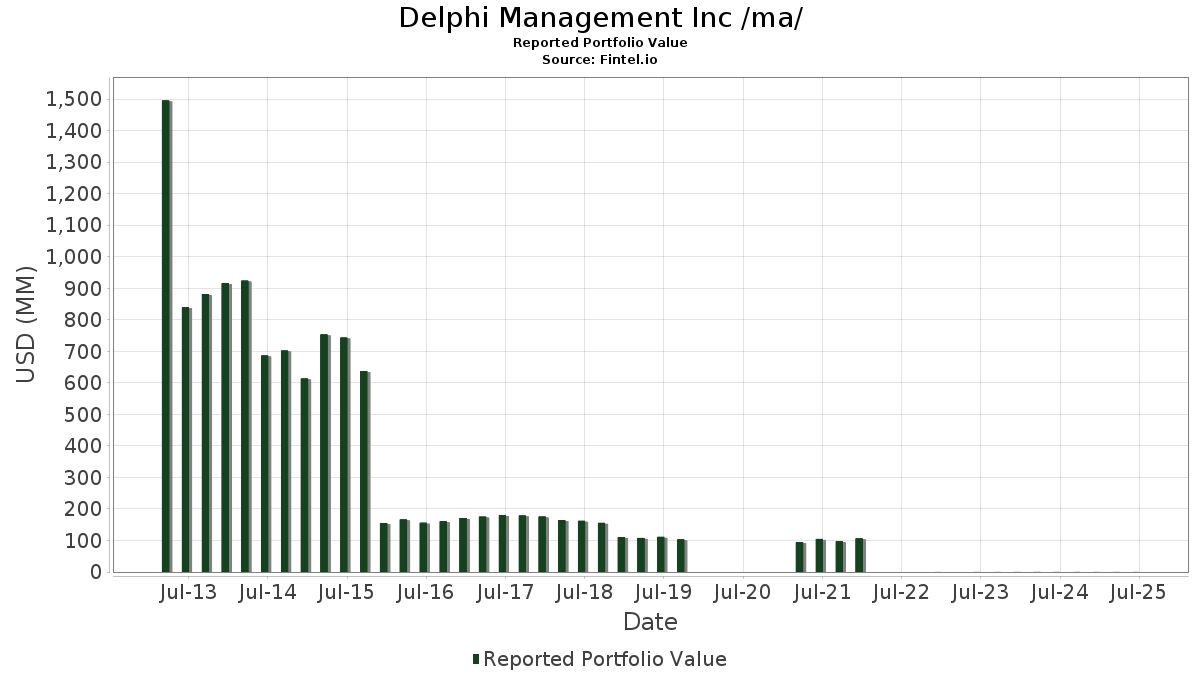
Delphi Management Inc /ma/ has disclosed 80 total holdings in their latest SEC filings. Most recent portfolio value is calculated to be $ 103,497 USD. Actual Assets Under Management (AUM) is this value plus cash (which is not disclosed). Delphi Management Inc /ma/’s top holdings are Berkshire Hathaway Inc. (US:BRK.B) , Jabil Inc. (US:JBL) , Apple Inc. (US:AAPL) , Flex Ltd. (US:FLEX) , and Atlanta Braves Holdings, Inc. (US:BATRK) . Delphi Management Inc /ma/’s new positions include The Hartford Insurance Group, Inc. (US:HIG) , NICE Ltd. - Depositary Receipt (Common Stock) (US:NICE) , First Industrial Realty Trust, Inc. (US:FR) , First American Financial Corporation (US:FAF) , and Integral Ad Science Holding Corp. (US:IAS) .
Top Increases This Quarter
We use the change in the portfolio allocation because this is the most meaningful metric. Changes can be due to trades or changes in share prices.
| Security | Shares (MM) |
Value (MM$) |
Portfolio % | ΔPortfolio % |
|---|---|---|---|---|
| 0.03 | 0.00 | 1.3179 | 1.3179 | |
| 0.13 | 0.00 | 1.3169 | 1.3169 | |
| 0.01 | 0.00 | 1.2590 | 1.2590 | |
| 0.03 | 0.00 | 1.2387 | 1.2387 | |
| 0.01 | 0.00 | 1.2058 | 1.2058 | |
| 0.03 | 0.00 | 1.1788 | 1.1788 | |
| 0.02 | 0.00 | 1.0754 | 1.0754 | |
| 0.02 | 0.00 | 1.1169 | 0.8204 | |
| 0.03 | 0.00 | 1.2464 | 0.7389 | |
| 0.02 | 0.00 | 1.2909 | 0.6173 |
Top Decreases This Quarter
We use the change in the portfolio allocation because this is the most meaningful metric. Changes can be due to trades or changes in share prices.
| Security | Shares (MM) |
Value (MM$) |
Portfolio % | ΔPortfolio % |
|---|---|---|---|---|
| 0.00 | 0.00 | -1.1352 | ||
| 0.01 | 0.00 | 2.6358 | -0.6770 | |
| 0.03 | 0.00 | 0.9111 | -0.4584 | |
| 0.01 | 0.00 | 0.9063 | -0.4113 | |
| 0.01 | 0.00 | 1.6860 | -0.4009 | |
| 0.01 | 0.00 | 1.0213 | -0.3310 | |
| 0.00 | 0.00 | 1.1353 | -0.3229 | |
| 0.01 | 0.00 | 1.0396 | -0.2963 | |
| 0.01 | 0.00 | 1.0058 | -0.2761 | |
| 0.00 | 0.00 | 1.1189 | -0.2721 |
13F and Fund Filings
This form was filed on 2025-07-07 for the reporting period 2025-06-30. Click the link icon to see the full transaction history.
Upgrade to unlock premium data and export to Excel ![]() .
.
| Security | Type | Avg Share Price | Shares (MM) |
ΔShares (%) |
ΔShares (%) |
Value ($MM) |
Portfolio (%) |
ΔPortfolio (%) |
|
|---|---|---|---|---|---|---|---|---|---|
| BRK.B / Berkshire Hathaway Inc. | 0.01 | -7.99 | 0.00 | -33.33 | 2.6358 | -0.6770 | |||
| JBL / Jabil Inc. | 0.01 | -14.99 | 0.00 | 0.00 | 1.7044 | 0.3858 | |||
| AAPL / Apple Inc. | 0.01 | -7.73 | 0.00 | -50.00 | 1.6860 | -0.4009 | |||
| FLEX / Flex Ltd. | 0.03 | -13.67 | 0.00 | 0.00 | 1.6058 | 0.3056 | |||
| BATRK / Atlanta Braves Holdings, Inc. | 0.04 | -5.60 | 0.00 | 0.00 | 1.5856 | 0.0703 | |||
| CAKE / The Cheesecake Factory Incorporated | 0.03 | -8.00 | 0.00 | 0.00 | 1.5749 | 0.1727 | |||
| LRCX / Lam Research Corporation | 0.02 | -0.04 | 0.00 | 0.00 | 1.5672 | 0.3321 | |||
| GSCE / GS Connect S&P GSCI Enhanced Commodity Total Return ETN | 0.00 | -4.74 | 0.00 | 0.00 | 1.5537 | 0.2259 | |||
| MS / Morgan Stanley | 0.01 | -2.67 | 0.00 | 0.00 | 1.5411 | 0.1583 | |||
| ORCL / Oracle Corporation | 0.01 | -7.73 | 0.00 | 0.00 | 1.5382 | 0.4142 | |||
| FTXP / Foothills Exploration, Inc. | 0.00 | -10.66 | 0.00 | 0.00 | 1.5305 | 0.1599 | |||
| JPM / JPMorgan Chase & Co. | 0.01 | -4.96 | 0.00 | 0.00 | 1.5199 | 0.0932 | |||
| SANM / Sanmina Corporation | 0.02 | -7.35 | 0.00 | 0.00 | 1.5073 | 0.1713 | |||
| DIS / The Walt Disney Company | 0.01 | -6.03 | 0.00 | 0.00 | 1.5025 | 0.1604 | |||
| TPR / Tapestry, Inc. | 0.02 | -6.14 | 0.00 | 0.00 | 1.4880 | 0.1469 | |||
| AMAT / Applied Materials, Inc. | 0.01 | -1.08 | 0.00 | 0.00 | 1.4599 | 0.2259 | |||
| AXP / American Express Company | 0.00 | -9.52 | 0.00 | 0.00 | 1.4435 | 0.0240 | |||
| NFG / National Fuel Gas Company | 0.02 | -9.84 | 0.00 | 0.00 | 1.4358 | -0.1345 | |||
| LDOS / Leidos Holdings, Inc. | 0.01 | -7.80 | 0.00 | 0.00 | 1.4203 | 0.0304 | |||
| NVS / Novartis AG - Depositary Receipt (Common Stock) | 0.01 | -8.66 | 0.00 | 0.00 | 1.4203 | -0.0909 | |||
| SNX / TD SYNNEX Corporation | 0.01 | 1.72 | 0.00 | 0.00 | 1.4174 | 0.2914 | |||
| WRB / W. R. Berkley Corporation | 0.02 | -11.00 | 0.00 | 0.00 | 1.4136 | -0.2087 | |||
| UNTY / Unity Bancorp, Inc. | 0.03 | -4.53 | 0.00 | 0.00 | 1.3884 | 0.0627 | |||
| LH / Labcorp Holdings Inc. | 0.01 | -10.47 | 0.00 | 0.00 | 1.3884 | -0.0616 | |||
| SSNC / SS&C Technologies Holdings, Inc. | 0.02 | -5.16 | 0.00 | 0.00 | 1.3865 | -0.1685 | |||
| DELL / Dell Technologies Inc. | 0.01 | -6.58 | 0.00 | 0.00 | 1.3865 | 0.2228 | |||
| FI / Fiserv, Inc. | 0.01 | 22.89 | 0.00 | 0.00 | 1.3826 | -0.1367 | |||
| AZZ / AZZ Inc. | 0.02 | -5.82 | 0.00 | 0.00 | 1.3826 | 0.0131 | |||
| STAG / STAG Industrial, Inc. | 0.04 | -4.50 | 0.00 | 0.00 | 1.3682 | -0.1369 | |||
| TXT / Textron Inc. | 0.02 | 0.57 | 0.00 | 0.00 | 1.3595 | 0.0765 | |||
| HTGC / Hercules Capital, Inc. | 0.08 | 5.35 | 0.00 | 0.00 | 1.3508 | -0.0698 | |||
| ITRN / Ituran Location and Control Ltd. | 0.04 | -5.31 | 0.00 | 0.00 | 1.3498 | -0.0534 | |||
| JHG / Janus Henderson Group plc | 0.04 | -0.22 | 0.00 | 0.00 | 1.3450 | 0.0223 | |||
| DOX / Amdocs Limited | 0.02 | -6.98 | 0.00 | 0.00 | 1.3430 | -0.1845 | |||
| INGR / Ingredion Incorporated | 0.01 | -8.30 | 0.00 | 0.00 | 1.3382 | -0.1964 | |||
| RL / Ralph Lauren Corporation | 0.01 | -11.60 | 0.00 | 0.00 | 1.3353 | 0.0534 | |||
| ARCC / Ares Capital Corporation | 0.06 | -4.64 | 0.00 | 0.00 | 1.3305 | -0.1542 | |||
| SF / Stifel Financial Corp. | 0.01 | -3.24 | 0.00 | 0.00 | 1.3295 | 0.0139 | |||
| USB / U.S. Bancorp | 0.03 | 0.00 | 1.3179 | 1.3179 | |||||
| ASX / ASE Technology Holding Co., Ltd. - Depositary Receipt (Common Stock) | 0.13 | 0.00 | 1.3169 | 1.3169 | |||||
| PRGS / Progress Software Corporation | 0.02 | -5.84 | 0.00 | 0.00 | 1.3102 | 0.1261 | |||
| PUBGY / Publicis Groupe S.A. - Depositary Receipt (Common Stock) | 0.05 | 69.90 | 0.00 | 1.3044 | 0.6053 | ||||
| BXSL / Blackstone Secured Lending Fund | 0.04 | -2.40 | 0.00 | 0.00 | 1.2976 | -0.1789 | |||
| SDZNY / Sandoz Group AG - Depositary Receipt (Common Stock) | 0.02 | 55.10 | 0.00 | 1.2909 | 0.6173 | ||||
| CB / Chubb Limited | 0.00 | -7.99 | 0.00 | 0.00 | 1.2793 | -0.2493 | |||
| GHC / Graham Holdings Company | 0.00 | -10.65 | 0.00 | 0.00 | 1.2735 | -0.2530 | |||
| THG / The Hanover Insurance Group, Inc. | 0.01 | -7.20 | 0.00 | 0.00 | 1.2638 | -0.2066 | |||
| HIG / The Hartford Insurance Group, Inc. | 0.01 | 0.00 | 1.2590 | 1.2590 | |||||
| 3LR / Camden National Corporation | 0.03 | 158.54 | 0.00 | 1.2464 | 0.7389 | ||||
| REVG / REV Group, Inc. | 0.03 | 0.00 | 1.2387 | 1.2387 | |||||
| EXPE / Expedia Group, Inc. | 0.01 | -5.82 | 0.00 | 0.00 | 1.2348 | -0.1439 | |||
| DHI / D.R. Horton, Inc. | 0.01 | 9.83 | 0.00 | 0.00 | 1.2339 | 0.0660 | |||
| ARW / Arrow Electronics, Inc. | 0.01 | -4.83 | 0.00 | 0.00 | 1.2339 | 0.1201 | |||
| RNR / RenaissanceRe Holdings Ltd. | 0.01 | -8.08 | 0.00 | 0.00 | 1.2145 | -0.1622 | |||
| NICE / NICE Ltd. - Depositary Receipt (Common Stock) | 0.01 | 0.00 | 1.2058 | 1.2058 | |||||
| FR / First Industrial Realty Trust, Inc. | 0.03 | 0.00 | 1.1788 | 1.1788 | |||||
| ASIX / AdvanSix Inc. | 0.05 | -3.01 | 0.00 | 0.00 | 1.1537 | -0.0427 | |||
| LEN / Lennar Corporation | 0.01 | 13.57 | 0.00 | 0.00 | 1.1392 | 0.0407 | |||
| CBT / Cabot Corporation | 0.02 | -5.67 | 0.00 | 0.00 | 1.1363 | -0.2720 | |||
| EOG / EOG Resources, Inc. | 0.01 | -6.07 | 0.00 | 0.00 | 1.1353 | -0.2312 | |||
| TOL / Toll Brothers, Inc. | 0.01 | 8.04 | 0.00 | 0.00 | 1.1353 | 0.1102 | |||
| EG / Everest Group, Ltd. | 0.00 | -12.21 | 0.00 | 0.00 | 1.1353 | -0.3229 | |||
| SNA / Snap-on Incorporated | 0.00 | -8.15 | 0.00 | 0.00 | 1.1189 | -0.2721 | |||
| KBR / KBR, Inc. | 0.02 | 312.10 | 0.00 | 1.1169 | 0.8204 | ||||
| NXST / Nexstar Media Group, Inc. | 0.01 | -6.73 | 0.00 | 0.00 | 1.1121 | -0.1912 | |||
| AZO / AutoZone, Inc. | 0.00 | -11.75 | 0.00 | 0.00 | 1.1044 | -0.2519 | |||
| FAF / First American Financial Corporation | 0.02 | 0.00 | 1.0754 | 1.0754 | |||||
| EXP / Eagle Materials Inc. | 0.01 | -9.87 | 0.00 | 0.00 | 1.0396 | -0.2963 | |||
| MTDR / Matador Resources Company | 0.02 | -3.96 | 0.00 | 0.00 | 1.0319 | -0.1807 | |||
| FANG / Diamondback Energy, Inc. | 0.01 | -7.31 | 0.00 | 0.00 | 1.0213 | -0.3310 | |||
| ABBV / AbbVie Inc. | 0.01 | -6.63 | 0.00 | 0.00 | 1.0058 | -0.2761 | |||
| SLB N / Schlumberger Limited | 0.03 | -13.27 | 0.00 | -100.00 | 0.9111 | -0.4584 | |||
| OMC / Omnicom Group Inc. | 0.01 | -16.42 | 0.00 | -100.00 | 0.9063 | -0.4113 | |||
| IAS / Integral Ad Science Holding Corp. | 0.06 | 0.00 | 0.5208 | 0.5208 | |||||
| ANF / Abercrombie & Fitch Co. | 0.01 | 0.03 | 0.00 | 0.5169 | 0.0145 | ||||
| INCY / Incyte Corporation | 0.01 | -6.53 | 0.00 | 0.4561 | -0.0015 | ||||
| GBDC / Golub Capital BDC, Inc. | 0.03 | -1.82 | 0.00 | 0.4232 | -0.0466 | ||||
| BHRB / Burke & Herbert Financial Services Corp. | 0.01 | -6.09 | 0.00 | 0.2995 | -0.0164 | ||||
| URBN / Urban Outfitters, Inc. | 0.00 | 0.00 | 0.2937 | 0.2937 | |||||
| STLD / Steel Dynamics, Inc. | 0.00 | 0.00 | 0.1942 | 0.1942 | |||||
| OSK / Oshkosh Corporation | 0.00 | -100.00 | 0.00 | 0.0000 | |||||
| GPN / Global Payments Inc. | 0.00 | -100.00 | 0.00 | -100.00 | -1.1352 | ||||
| SKX / Skechers U.S.A., Inc. | 0.00 | -100.00 | 0.00 | 0.0000 | |||||
| IRM / Iron Mountain Incorporated | 0.00 | -100.00 | 0.00 | 0.0000 | |||||
| CVLG / Covenant Logistics Group, Inc. | 0.00 | -100.00 | 0.00 | 0.0000 | |||||
| PLAB / Photronics, Inc. | 0.00 | -100.00 | 0.00 | 0.0000 | |||||
| EMN / Eastman Chemical Company | 0.00 | -100.00 | 0.00 | 0.0000 | |||||
| AVB / AvalonBay Communities, Inc. | 0.00 | -100.00 | 0.00 | 0.0000 |