Basic Stats
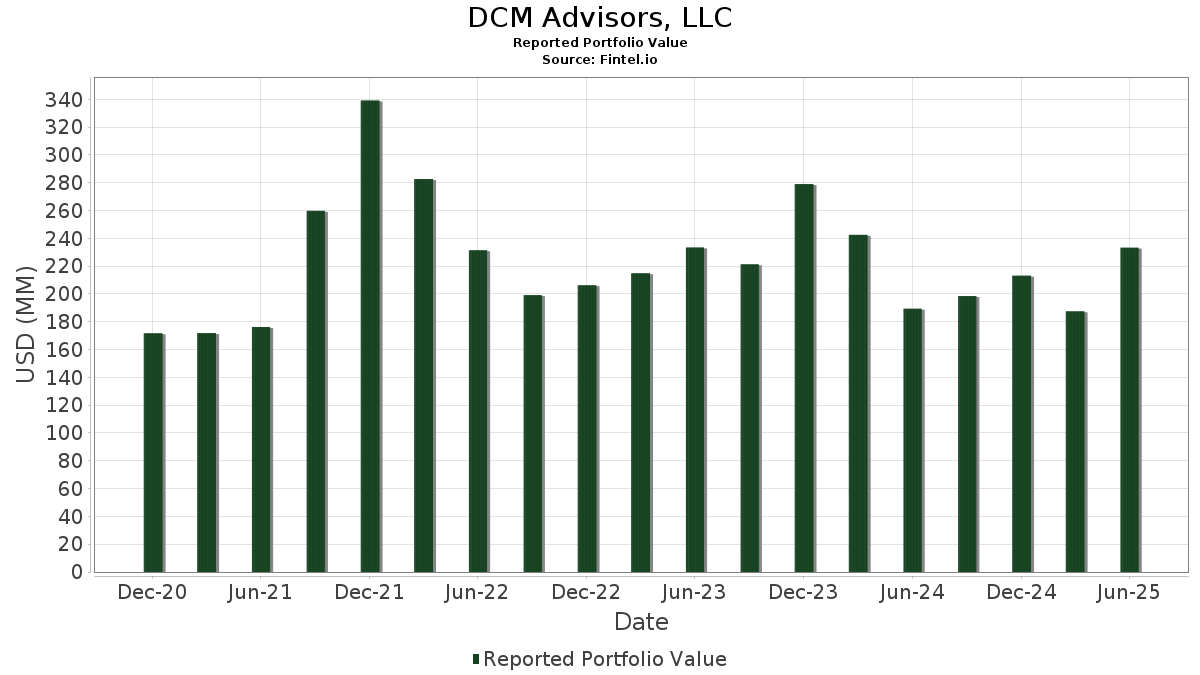
| Portfolio Value | $ 233,274,010 |
| Current Positions | 39 |
Latest Holdings, Performance, AUM (from 13F, 13D)
DCM Advisors, LLC has disclosed 39 total holdings in their latest SEC filings. Most recent portfolio value is calculated to be $ 233,274,010 USD. Actual Assets Under Management (AUM) is this value plus cash (which is not disclosed). DCM Advisors, LLC’s top holdings are Microsoft Corporation (US:MSFT) , Apple Inc. (US:AAPL) , Meta Platforms, Inc. (US:META) , Oracle Corporation (US:ORCL) , and The Goldman Sachs Group, Inc. (US:GS) .
Top Increases This Quarter
We use the change in the portfolio allocation because this is the most meaningful metric. Changes can be due to trades or changes in share prices.
| Security | Shares (MM) |
Value (MM$) |
Portfolio % | ΔPortfolio % |
|---|---|---|---|---|
| 0.06 | 12.77 | 5.4752 | 1.5560 | |
| 0.04 | 18.12 | 7.7668 | 0.9870 | |
| 0.06 | 7.87 | 3.3726 | 0.7448 | |
| 0.01 | 1.69 | 0.7237 | 0.7237 | |
| 0.02 | 12.43 | 5.3265 | 0.6879 | |
| 0.10 | 12.13 | 5.1999 | 0.5994 | |
| 0.02 | 13.17 | 5.6456 | 0.5894 | |
| 0.07 | 10.28 | 4.4059 | 0.3376 | |
| 0.17 | 0.74 | 0.3177 | 0.3177 | |
| 0.05 | 0.48 | 0.2046 | 0.2046 |
Top Decreases This Quarter
We use the change in the portfolio allocation because this is the most meaningful metric. Changes can be due to trades or changes in share prices.
| Security | Shares (MM) |
Value (MM$) |
Portfolio % | ΔPortfolio % |
|---|---|---|---|---|
| 0.07 | 13.34 | 5.7171 | -1.3524 | |
| 0.02 | 8.70 | 3.7306 | -1.0835 | |
| 0.11 | 9.78 | 4.1919 | -0.7260 | |
| 0.03 | 5.18 | 2.2212 | -0.6653 | |
| 0.01 | 1.56 | 0.6679 | -0.5425 | |
| 0.03 | 5.60 | 2.4021 | -0.4614 | |
| 0.03 | 5.30 | 2.2709 | -0.3487 | |
| 0.01 | 3.51 | 1.5060 | -0.3289 | |
| 0.08 | 5.22 | 2.2366 | -0.3028 | |
| 0.05 | 2.04 | 0.8726 | -0.2741 |
13F and Fund Filings
This form was filed on 2025-08-15 for the reporting period 2025-06-30. Click the link icon to see the full transaction history.
Upgrade to unlock premium data and export to Excel ![]() .
.
| Security | Type | Avg Share Price | Shares (MM) |
ΔShares (%) |
ΔShares (%) |
Value ($MM) |
Portfolio (%) |
ΔPortfolio (%) |
|
|---|---|---|---|---|---|---|---|---|---|
| MSFT / Microsoft Corporation | 0.04 | 6.37 | 18.12 | 42.54 | 7.7668 | 0.9870 | |||
| AAPL / Apple Inc. | 0.07 | 7.88 | 13.34 | 0.62 | 5.7171 | -1.3524 | |||
| META / Meta Platforms, Inc. | 0.02 | 8.00 | 13.17 | 38.93 | 5.6456 | 0.5894 | |||
| ORCL / Oracle Corporation | 0.06 | 10.11 | 12.77 | 73.84 | 5.4752 | 1.5560 | |||
| GS / The Goldman Sachs Group, Inc. | 0.02 | 9.51 | 12.43 | 42.88 | 5.3265 | 0.6879 | |||
| DIS / The Walt Disney Company | 0.10 | 11.39 | 12.13 | 40.64 | 5.1999 | 0.5994 | |||
| AXP / American Express Company | 0.03 | 7.24 | 10.34 | 27.48 | 4.4321 | 0.1061 | |||
| MS / Morgan Stanley | 0.07 | 10.79 | 10.28 | 34.74 | 4.4059 | 0.3376 | |||
| WFC / Wells Fargo & Company | 0.12 | 10.19 | 9.82 | 23.90 | 4.2116 | -0.0177 | |||
| AIG / American International Group, Inc. | 0.11 | 7.15 | 9.78 | 6.05 | 4.1919 | -0.7260 | |||
| BAC / Bank of America Corporation | 0.21 | 10.41 | 9.75 | 26.12 | 4.1810 | 0.0562 | |||
| JPM / JPMorgan Chase & Co. | 0.03 | 10.18 | 9.16 | 30.94 | 3.9250 | 0.1954 | |||
| BRK.B / Berkshire Hathaway Inc. | 0.02 | 5.54 | 8.70 | -3.58 | 3.7306 | -1.0835 | |||
| DELL / Dell Technologies Inc. | 0.06 | 18.73 | 7.87 | 59.70 | 3.3726 | 0.7448 | |||
| CMCSA / Comcast Corporation | 0.19 | 18.46 | 6.65 | 15.20 | 2.8528 | -0.2281 | |||
| MPC / Marathon Petroleum Corporation | 0.03 | 7.98 | 5.78 | 23.66 | 2.4778 | -0.0156 | |||
| RH / RH | 0.03 | 28.80 | 5.60 | 4.38 | 2.4021 | -0.4614 | |||
| RTX / RTX Corporation | 0.04 | 5.93 | 5.44 | 17.21 | 2.3333 | -0.1435 | |||
| GOOGL / Alphabet Inc. | 0.03 | -6.21 | 5.30 | 7.86 | 2.2709 | -0.3487 | |||
| CVS / CVS Health Corporation | 0.08 | 7.12 | 5.22 | 9.60 | 2.2366 | -0.3028 | |||
| ABBV / AbbVie Inc. | 0.03 | 7.96 | 5.18 | -4.25 | 2.2212 | -0.6653 | |||
| PM / Philip Morris International Inc. | 0.02 | 8.41 | 4.45 | 24.54 | 1.9082 | 0.0014 | |||
| CSX / CSX Corporation | 0.12 | 10.47 | 3.86 | 23.18 | 1.6566 | -0.0171 | |||
| MCD / McDonald's Corporation | 0.01 | 8.58 | 3.51 | 2.12 | 1.5060 | -0.3289 | |||
| GOOG / Alphabet Inc. | 0.02 | 24.93 | 3.15 | 43.65 | 1.3488 | 0.1806 | |||
| T / AT&T Inc. | 0.10 | 17.81 | 2.93 | 22.03 | 1.2543 | -0.0243 | |||
| BA / The Boeing Company | 0.01 | 8.23 | 2.63 | 33.47 | 1.1266 | 0.0760 | |||
| PSX / Phillips 66 | 0.02 | 10.68 | 2.61 | 7.55 | 1.1176 | -0.1756 | |||
| VZ / Verizon Communications Inc. | 0.05 | -1.14 | 2.04 | -5.30 | 0.8726 | -0.2741 | |||
| PEP / PepsiCo, Inc. | 0.01 | 8.50 | 1.89 | -3.91 | 0.8102 | -0.2393 | |||
| COP / ConocoPhillips | 0.02 | 9.04 | 1.77 | -6.32 | 0.7570 | -0.2481 | |||
| PG / The Procter & Gamble Company | 0.01 | 1.69 | 0.7237 | 0.7237 | |||||
| USB / U.S. Bancorp | 0.04 | -20.55 | 1.59 | 20.17 | 0.6823 | -0.0240 | |||
| NVDA / NVIDIA Corporation | 0.01 | -49.43 | 1.56 | -31.34 | 0.6679 | -0.5425 | |||
| PFE / Pfizer Inc. | 0.03 | 19.67 | 0.77 | 14.82 | 0.3290 | -0.0278 | |||
| LUMN / Lumen Technologies, Inc. | 0.17 | 0.74 | 0.3177 | 0.3177 | |||||
| AGNC / AGNC Investment Corp. | 0.05 | 0.48 | 0.2046 | 0.2046 | |||||
| ARCC / Ares Capital Corporation | 0.02 | 4.03 | 0.47 | -3.68 | 0.2021 | -0.0590 | |||
| OBDC / Blue Owl Capital Corporation | 0.02 | -6.92 | 0.32 | -12.26 | 0.1382 | -0.0578 |