Basic Stats
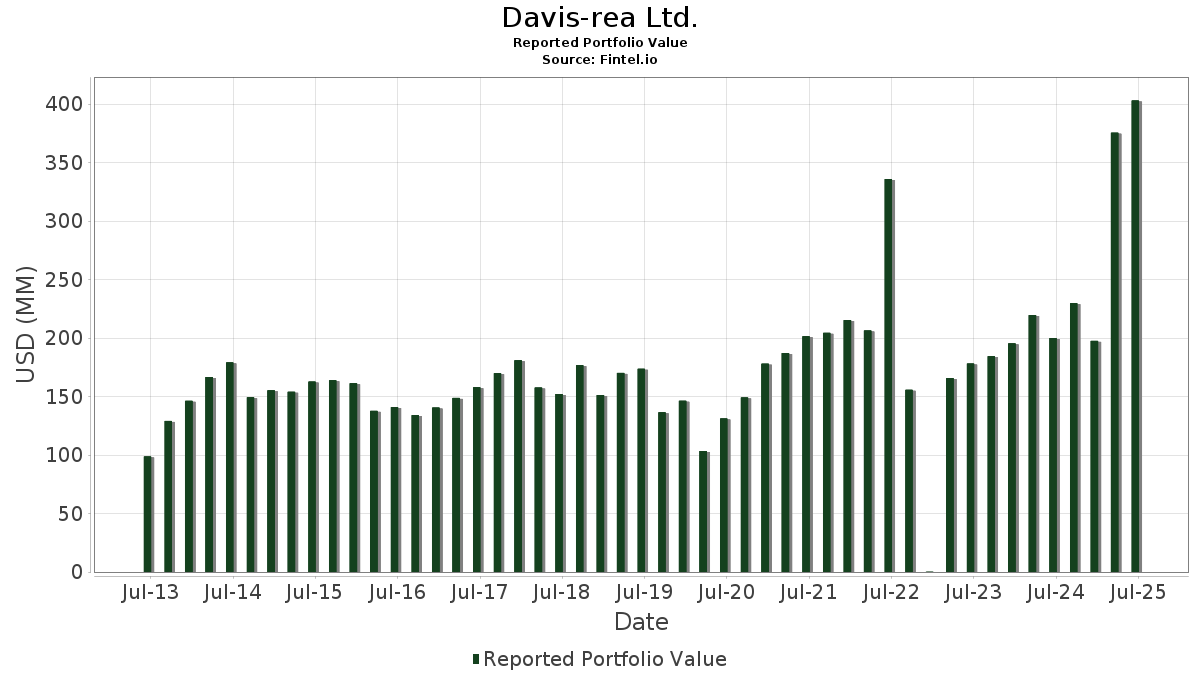
| Portfolio Value | $ 403,022,189 |
| Current Positions | 60 |
Latest Holdings, Performance, AUM (from 13F, 13D)
Davis-rea Ltd. has disclosed 60 total holdings in their latest SEC filings. Most recent portfolio value is calculated to be $ 403,022,189 USD. Actual Assets Under Management (AUM) is this value plus cash (which is not disclosed). Davis-rea Ltd.’s top holdings are Meta Platforms, Inc. (US:META) , Alphabet Inc. (US:GOOGL) , Amazon.com, Inc. (US:AMZN) , JPMorgan Chase & Co. (US:JPM) , and Microsoft Corporation (US:MSFT) . Davis-rea Ltd.’s new positions include CRH plc (US:CRH) , Avantor, Inc. (US:AVTR) , Newmont Corporation (US:NEM) , Stryker Corporation (US:SYK) , and SPDR S&P 500 ETF (US:SPY) .
Top Increases This Quarter
We use the change in the portfolio allocation because this is the most meaningful metric. Changes can be due to trades or changes in share prices.
| Security | Shares (MM) |
Value (MM$) |
Portfolio % | ΔPortfolio % |
|---|---|---|---|---|
| 0.06 | 12.71 | 3.1536 | 1.8356 | |
| 0.05 | 10.05 | 2.4939 | 0.9536 | |
| 0.12 | 26.50 | 6.5745 | 0.6928 | |
| 0.03 | 2.74 | 0.6791 | 0.6791 | |
| 0.04 | 6.43 | 1.5957 | 0.6762 | |
| 0.09 | 24.87 | 6.1712 | 0.5255 | |
| 0.02 | 1.84 | 0.4556 | 0.4556 | |
| 0.02 | 12.28 | 3.0458 | 0.3199 | |
| 0.16 | 27.63 | 6.8555 | 0.2077 | |
| 0.09 | 11.94 | 2.9615 | 0.1876 |
Top Decreases This Quarter
We use the change in the portfolio allocation because this is the most meaningful metric. Changes can be due to trades or changes in share prices.
| Security | Shares (MM) |
Value (MM$) |
Portfolio % | ΔPortfolio % |
|---|---|---|---|---|
| 0.02 | 6.30 | 1.5627 | -1.7217 | |
| 0.05 | 39.48 | 9.7965 | -1.1088 | |
| 0.04 | 17.57 | 4.3602 | -0.6406 | |
| 0.04 | 22.20 | 5.5085 | -0.4061 | |
| 0.03 | 8.10 | 2.0097 | -0.2845 | |
| 0.02 | 6.31 | 1.5656 | -0.2754 | |
| 0.03 | 3.84 | 0.9518 | -0.1644 | |
| 0.02 | 4.84 | 1.2020 | -0.1607 | |
| 0.11 | 4.16 | 1.0321 | -0.1481 | |
| 0.01 | 5.06 | 1.2560 | -0.1420 |
13F and Fund Filings
This form was filed on 2025-07-24 for the reporting period 2025-06-30. Click the link icon to see the full transaction history.
Upgrade to unlock premium data and export to Excel ![]() .
.
| Security | Type | Avg Share Price | Shares (MM) |
ΔShares (%) |
ΔShares (%) |
Value ($MM) |
Portfolio (%) |
ΔPortfolio (%) |
|
|---|---|---|---|---|---|---|---|---|---|
| META / Meta Platforms, Inc. | 0.05 | -24.71 | 39.48 | -3.58 | 9.7965 | -1.1088 | |||
| GOOGL / Alphabet Inc. | 0.16 | -2.88 | 27.63 | 10.68 | 6.8555 | 0.2077 | |||
| AMZN / Amazon.com, Inc. | 0.12 | 4.04 | 26.50 | 19.97 | 6.5745 | 0.6928 | |||
| JPM / JPMorgan Chase & Co. | 0.09 | -0.73 | 24.87 | 17.32 | 6.1712 | 0.5255 | |||
| MSFT / Microsoft Corporation | 0.04 | -24.56 | 22.20 | -0.04 | 5.5085 | -0.4061 | |||
| TMO / Thermo Fisher Scientific Inc. | 0.04 | 14.80 | 17.57 | -6.42 | 4.3602 | -0.6406 | |||
| SYK / Stryker Corporation | 0.04 | -0.55 | 14.04 | 5.69 | 3.4825 | -0.0541 | |||
| AAPL / Apple Inc. | 0.06 | 178.03 | 12.71 | 156.80 | 3.1536 | 1.8356 | |||
| BAC / Bank of America Corporation | 0.26 | -0.02 | 12.50 | 13.38 | 3.1006 | 0.1655 | |||
| SNPS / Synopsys, Inc. | 0.02 | 0.31 | 12.28 | 19.93 | 3.0458 | 0.3199 | |||
| RY / Royal Bank of Canada | 0.09 | -1.72 | 11.94 | 14.58 | 2.9615 | 0.1876 | |||
| PNC / The PNC Financial Services Group, Inc. | 0.05 | 0.34 | 10.13 | 6.42 | 2.5126 | -0.0214 | |||
| NET / Cloudflare, Inc. | 0.05 | 0.00 | 10.05 | 73.80 | 2.4939 | 0.9536 | |||
| ACN / Accenture plc | 0.03 | -1.85 | 8.10 | -5.99 | 2.0097 | -0.2845 | |||
| FTS / Fortis Inc. | 0.16 | -1.82 | 7.76 | 3.73 | 1.9252 | -0.0666 | |||
| ANSS / ANSYS, Inc. | 0.02 | 1.68 | 7.14 | 12.81 | 1.7721 | 0.0861 | |||
| BN / Brookfield Corporation | 0.11 | -1.13 | 7.02 | 16.51 | 1.7420 | 0.1374 | |||
| TD / The Toronto-Dominion Bank | 0.09 | -5.82 | 6.85 | 15.18 | 1.7004 | 0.1160 | |||
| ZTS / Zoetis Inc. | 0.04 | 96.65 | 6.43 | 86.30 | 1.5957 | 0.6762 | |||
| V / Visa Inc. | 0.02 | -2.53 | 6.37 | -1.24 | 1.5808 | -0.1374 | |||
| MCD / McDonald's Corporation | 0.02 | -2.42 | 6.31 | -8.74 | 1.5656 | -0.2754 | |||
| UNH / UnitedHealth Group Incorporated | 0.02 | -14.27 | 6.30 | -48.93 | 1.5627 | -1.7217 | |||
| BNS / The Bank of Nova Scotia | 0.09 | -2.62 | 5.12 | 13.10 | 1.2709 | 0.0649 | |||
| ROP / Roper Technologies, Inc. | 0.01 | 0.29 | 5.06 | -3.58 | 1.2560 | -0.1420 | |||
| ABT / Abbott Laboratories | 0.04 | -4.29 | 5.00 | -1.87 | 1.2400 | -0.1162 | |||
| RTX / RTX Corporation | 0.03 | -2.68 | 4.92 | 7.29 | 1.2198 | -0.0005 | |||
| LIN / Linde plc | 0.01 | -0.66 | 4.91 | 1.28 | 1.2194 | -0.0727 | |||
| ENB / Enbridge Inc. | 0.11 | -0.43 | 4.90 | 1.62 | 1.2167 | -0.0684 | |||
| SPGI / S&P Global Inc. | 0.01 | -0.51 | 4.88 | 3.26 | 1.2110 | -0.0478 | |||
| CB / Chubb Limited | 0.02 | -1.65 | 4.84 | -5.32 | 1.2020 | -0.1607 | |||
| MDLZ / Mondelez International, Inc. | 0.06 | -0.50 | 4.28 | -0.42 | 1.0611 | -0.0825 | |||
| OTIS / Otis Worldwide Corporation | 0.04 | -0.07 | 4.26 | -4.12 | 1.0559 | -0.1261 | |||
| PBA / Pembina Pipeline Corporation | 0.11 | 0.40 | 4.16 | -6.14 | 1.0321 | -0.1481 | |||
| HD / The Home Depot, Inc. | 0.01 | 1.66 | 4.01 | 1.70 | 0.9960 | -0.0551 | |||
| XYL / Xylem Inc. | 0.03 | 0.91 | 3.97 | 9.28 | 0.9853 | 0.0176 | |||
| DIS / The Walt Disney Company | 0.03 | 3.41 | 3.97 | 30.45 | 0.9844 | 0.1745 | |||
| CNI / Canadian National Railway Company | 0.04 | 6.70 | 3.97 | 13.77 | 0.9842 | 0.0558 | |||
| BEPI / Brookfield BRP Holdings (Canada) Inc. - Corporate Bond/Note | 0.15 | -0.26 | 3.90 | 14.39 | 0.9668 | 0.0597 | |||
| JNJ / Johnson & Johnson | 0.03 | -0.63 | 3.84 | -8.47 | 0.9518 | -0.1644 | |||
| GIB / CGI Inc. | 0.03 | 5.57 | 3.57 | 10.62 | 0.8863 | 0.0262 | |||
| UL / Unilever PLC - Depositary Receipt (Common Stock) | 0.06 | -0.31 | 3.39 | 2.42 | 0.8410 | -0.0404 | |||
| DHR / Danaher Corporation | 0.02 | -0.66 | 2.99 | -4.26 | 0.7417 | -0.0899 | |||
| SHY / iShares Trust - iShares 1-3 Year Treasury Bond ETF | 0.03 | 2.74 | 0.6791 | 0.6791 | |||||
| BIP / Brookfield Infrastructure Partners L.P. - Limited Partnership | 0.07 | -2.86 | 2.36 | 9.36 | 0.5860 | 0.0109 | |||
| ROK / Rockwell Automation, Inc. | 0.01 | 8.47 | 1.86 | 39.47 | 0.4604 | 0.1060 | |||
| CRH / CRH plc | 0.02 | 1.84 | 0.4556 | 0.4556 | |||||
| CTAS / Cintas Corporation | 0.01 | 0.00 | 1.78 | 8.39 | 0.4424 | 0.0045 | |||
| BRK.B / Berkshire Hathaway Inc. | 0.00 | -8.57 | 0.52 | -16.59 | 0.1286 | -0.0369 | |||
| GDXD / MicroSectors Gold Miners -3X Inverse Leveraged ETNs due June 29, 2040 | 0.00 | 0.00 | 0.44 | 15.97 | 0.1099 | 0.0081 | |||
| GOOGL / Alphabet Inc. | 0.00 | 0.00 | 0.35 | 13.31 | 0.0868 | 0.0048 | |||
| AVTR / Avantor, Inc. | 0.03 | 0.34 | 0.0835 | 0.0835 | |||||
| SPY / SPDR S&P 500 ETF | 0.00 | 0.23 | 0.0572 | 0.0572 | |||||
| NEM / Newmont Corporation | 0.00 | 0.21 | 0.0530 | 0.0530 | |||||
| SYK / Stryker Corporation | Put | 0.00 | 0.16 | 0.0394 | 0.0394 | ||||
| SPY / SPDR S&P 500 ETF | Put | 0.00 | 0.03 | 0.0083 | 0.0083 | ||||
| BAC / Bank of America Corporation | Put | 0.00 | 0.03 | 0.0078 | 0.0078 | ||||
| JNJ / Johnson & Johnson | Put | 0.00 | 0.02 | 0.0041 | 0.0041 | ||||
| META / Meta Platforms, Inc. | Put | 0.00 | 0.01 | 0.0026 | 0.0026 | ||||
| MSFT / Microsoft Corporation | Put | 0.00 | 0.01 | 0.0015 | 0.0015 | ||||
| NET / Cloudflare, Inc. | Put | 0.00 | 0.00 | 0.0002 | 0.0002 | ||||
| BTE / Baytex Energy Corp. | 0.00 | -100.00 | 0.00 | -100.00 | -0.0118 | ||||
| NVDD / Direxion Shares ETF Trust - Direxion Daily NVDA Bear 1X Shares | 0.00 | -100.00 | 0.00 | 0.0000 | |||||
| AQN / Algonquin Power & Utilities Corp. | 0.00 | -100.00 | 0.00 | 0.0000 |