Basic Stats
| Portfolio Value | $ 125,101,000 |
| Current Positions | 48 |
Latest Holdings, Performance, AUM (from 13F, 13D)
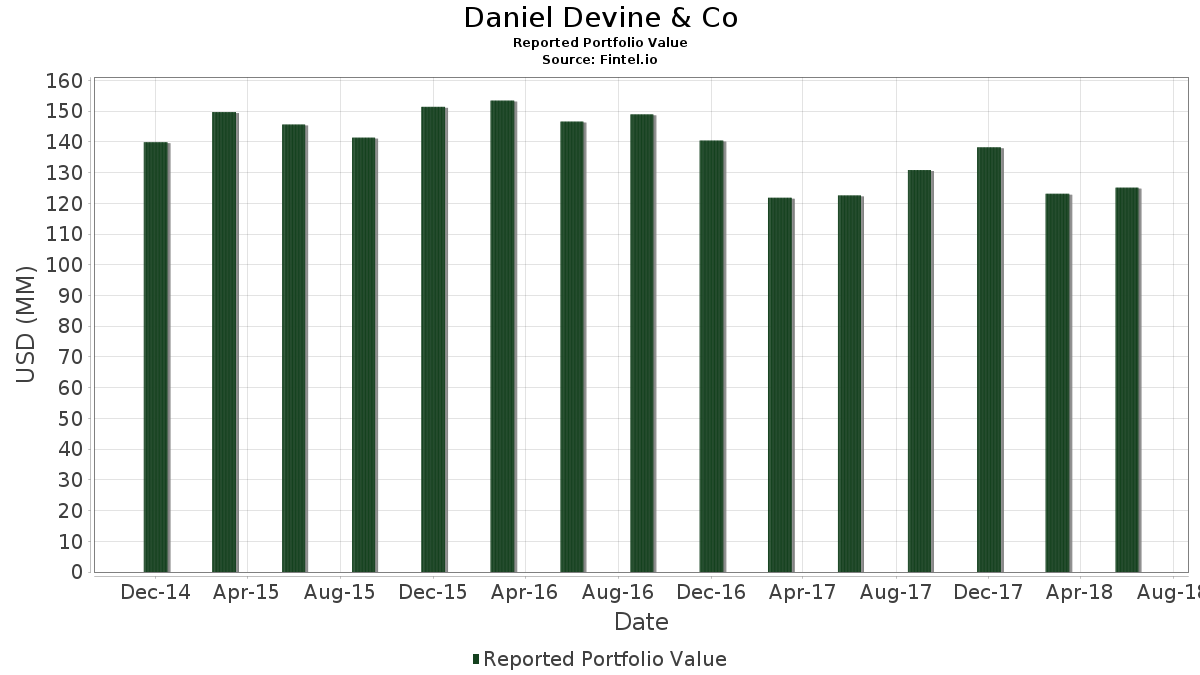
Daniel Devine & Co has disclosed 48 total holdings in their latest SEC filings. Most recent portfolio value is calculated to be $ 125,101,000 USD. Actual Assets Under Management (AUM) is this value plus cash (which is not disclosed). Daniel Devine & Co’s top holdings are SPDR S&P 500 ETF (US:SPY) , Invesco QQQ Trust, Series 1 (US:QQQ) , SPDR S&P MidCap 400 ETF Trust (US:MDY) , Apple Inc. (US:AAPL) , and iShares Trust - iShares Biotechnology ETF (US:IBB) . Daniel Devine & Co’s new positions include Walmart Inc. (US:WMT) , .
Top Increases This Quarter
We use the change in the portfolio allocation because this is the most meaningful metric. Changes can be due to trades or changes in share prices.
| Security | Shares (MM) |
Value (MM$) |
Portfolio % | ΔPortfolio % |
|---|---|---|---|---|
| 0.09 | 15.10 | 12.0718 | 12.0718 | |
| 0.04 | 13.10 | 10.4691 | 10.4691 | |
| 0.06 | 2.41 | 1.9264 | 1.9264 | |
| 0.01 | 2.07 | 1.6531 | 1.6531 | |
| 0.02 | 1.72 | 1.3709 | 1.3709 | |
| 0.00 | 1.70 | 1.3565 | 1.3565 | |
| 0.00 | 1.58 | 1.2614 | 1.2614 | |
| 0.01 | 1.55 | 1.2366 | 1.2366 | |
| 0.03 | 1.34 | 1.0711 | 1.0711 | |
| 0.01 | 1.32 | 1.0520 | 1.0520 |
Top Decreases This Quarter
We use the change in the portfolio allocation because this is the most meaningful metric. Changes can be due to trades or changes in share prices.
| Security | Shares (MM) |
Value (MM$) |
Portfolio % | ΔPortfolio % |
|---|---|---|---|---|
| 0.00 | 0.00 | -1.0836 | ||
| 0.01 | 0.51 | 0.4045 | -0.6580 | |
| 0.03 | 2.49 | 1.9904 | -0.3449 | |
| 0.02 | 1.39 | 1.1143 | -0.3072 | |
| 0.03 | 3.59 | 2.8721 | -0.2982 | |
| 0.00 | 0.24 | 0.1950 | -0.2403 | |
| 0.02 | 2.93 | 2.3421 | -0.2019 | |
| 0.05 | 1.98 | 1.5795 | -0.1287 | |
| 0.00 | 1.70 | 1.3605 | -0.1178 | |
| 0.01 | 1.93 | 1.5444 | -0.1151 |
13F and Fund Filings
This form was filed on 2018-07-18 for the reporting period 2018-06-30. Click the link icon to see the full transaction history.
Upgrade to unlock premium data and export to Excel ![]() .
.
| Security | Type | Avg Share Price | Shares (MM) |
ΔShares (%) |
ΔShares (%) |
Value ($MM) |
Portfolio (%) |
ΔPortfolio (%) |
|
|---|---|---|---|---|---|---|---|---|---|
| SPY / SPDR S&P 500 ETF | 0.11 | 1.43 | 28.61 | 4.57 | 22.8679 | 0.6452 | |||
| QQQ / Invesco QQQ Trust, Series 1 | 0.09 | 0.00 | 15.10 | 7.20 | 12.0718 | 12.0718 | |||
| MDY / SPDR S&P MidCap 400 ETF Trust | 0.04 | 2.79 | 13.10 | 6.78 | 10.4691 | 10.4691 | |||
| AAPL / Apple Inc. | 0.04 | 0.00 | 7.54 | 10.34 | 6.0311 | 0.4769 | |||
| IBB / iShares Trust - iShares Biotechnology ETF | 0.04 | 0.00 | 3.92 | 2.89 | 3.1303 | 0.0388 | |||
| JNJ / Johnson & Johnson | 0.03 | -2.79 | 3.59 | -7.94 | 2.8721 | -0.2982 | |||
| BRK.B / Berkshire Hathaway Inc. | 0.02 | 0.00 | 2.93 | -6.45 | 2.3421 | -0.2019 | |||
| V / Visa Inc. | 0.02 | 0.00 | 2.66 | 10.74 | 2.1263 | 0.1752 | |||
| ABBV / AbbVie Inc. | 0.03 | -11.52 | 2.49 | -13.39 | 1.9904 | -0.3449 | |||
| CVX / Chevron Corporation | 0.02 | -9.43 | 2.43 | 0.41 | 1.9416 | -0.0232 | |||
| EEM / iShares, Inc. - iShares MSCI Emerging Markets ETF | 0.06 | 0.00 | 2.41 | -10.28 | 1.9264 | 1.9264 | |||
| UNH / UnitedHealth Group Incorporated | 0.01 | 0.00 | 2.20 | 14.59 | 1.7578 | 0.1990 | |||
| HON / Honeywell International Inc. | 0.01 | -7.12 | 2.07 | -7.39 | 1.6531 | 1.6531 | |||
| PFE / Pfizer Inc. | 0.05 | -8.10 | 1.98 | -6.04 | 1.5795 | -0.1287 | |||
| COST / Costco Wholesale Corporation | 0.01 | 0.00 | 1.96 | 10.88 | 1.5643 | 0.1307 | |||
| FDX / FedEx Corporation | 0.01 | 0.00 | 1.93 | -5.43 | 1.5444 | -0.1151 | |||
| ZTS / Zoetis Inc. | 0.02 | 0.67 | 1.91 | 2.74 | 1.5284 | 0.0167 | |||
| GOOGL / Alphabet Inc. | 0.00 | -0.88 | 1.90 | 7.95 | 1.5204 | 0.0892 | |||
| WMT / Walmart Inc. | 0.02 | 1.72 | 1.3709 | 1.3709 | |||||
| C.WSA / Citigroup, Inc. | 0.00 | 1.49 | 1.70 | -6.48 | 1.3605 | -0.1178 | |||
| GOOG / Alphabet Inc. | 0.00 | 2.42 | 1.70 | 10.77 | 1.3565 | 1.3565 | |||
| SSNLF / Samsung Electronics Co., Ltd. | 0.00 | -6.21 | 1.58 | -14.79 | 1.2614 | 1.2614 | |||
| DIS / The Walt Disney Company | 0.01 | 3.58 | 1.55 | 8.11 | 1.2366 | 1.2366 | |||
| NVS / Novartis AG - Depositary Receipt (Common Stock) | 0.02 | -14.78 | 1.39 | -20.34 | 1.1143 | -0.3072 | |||
| SBUX / Starbucks Corporation | 0.03 | -7.27 | 1.34 | -21.73 | 1.0711 | 1.0711 | |||
| SAP / SAP SE - Depositary Receipt (Common Stock) | 0.01 | 9.64 | 1.32 | 20.62 | 1.0520 | 1.0520 | |||
| VFINX / Vanguard Index Funds - Vanguard Index Trust 500 Index Fund | 0.01 | 235.97 | 1.27 | 246.05 | 1.0152 | 1.0152 | |||
| RDS.B / Shell Plc - ADR | 0.02 | -22.05 | 1.26 | -13.53 | 1.0064 | 1.0064 | |||
| BX / Blackstone Inc. | 0.04 | 0.00 | 1.21 | 0.66 | 0.9688 | -0.0091 | |||
| IShares Stoxx Europe 600 / ETF (DE0002635) | 0.02 | 1.03 | 0.0000 | ||||||
| CNBKA / Century Bancorp, Inc. - Class A | 0.01 | 0.00 | 0.86 | -3.79 | 0.6890 | -0.0387 | |||
| ASH / Ashland Inc. | 0.01 | 1.86 | 0.86 | 14.13 | 0.6842 | 0.0751 | |||
| VWO / Vanguard International Equity Index Funds - Vanguard FTSE Emerging Markets ETF | 0.02 | 8.17 | 0.84 | -2.78 | 0.6699 | 0.6699 | |||
| APD / Air Products and Chemicals, Inc. | 0.01 | 0.00 | 0.82 | -2.03 | 0.6555 | -0.0244 | |||
| EXPD / Expeditors International of Washington, Inc. | 0.01 | 0.46 | 0.79 | 16.11 | 0.6339 | 0.0791 | |||
| XBI / SPDR Series Trust - SPDR S&P Biotech ETF | 0.01 | 17.46 | 0.70 | 27.31 | 0.5627 | 0.5627 | |||
| NTG / Tortoise Midstream Energy Fund, Inc. | 0.03 | 0.00 | 0.56 | 6.94 | 0.4436 | 0.4436 | |||
| AZN / AstraZeneca PLC - Depositary Receipt (Common Stock) | 0.01 | -61.50 | 0.51 | -61.31 | 0.4045 | -0.6580 | |||
| MA / Mastercard Incorporated | 0.00 | 0.00 | 0.48 | 12.18 | 0.3829 | 0.0361 | |||
| NSRGY / Nestlé S.A. - Depositary Receipt (Common Stock) | 0.01 | 0.00 | 0.43 | -2.07 | 0.3405 | 0.3405 | |||
| CSX / CSX Corporation | 0.01 | 0.00 | 0.41 | 14.44 | 0.3293 | 0.3293 | |||
| XLE / The Select Sector SPDR Trust - The Energy Select Sector SPDR Fund | 0.01 | 0.00 | 0.40 | 12.53 | 0.3229 | 0.3229 | |||
| ABT / Abbott Laboratories | 0.01 | 0.00 | 0.34 | 1.81 | 0.2702 | 0.0005 | |||
| IOO / iShares Trust - iShares Global 100 ETF | 0.01 | 45.76 | 0.30 | -26.73 | 0.2366 | 0.2366 | |||
| PG / The Procter & Gamble Company | 0.00 | 0.00 | 0.28 | -1.78 | 0.2206 | -0.0076 | |||
| XLI / The Select Sector SPDR Trust - The Industrial Select Sector SPDR Fund | 0.00 | 0.00 | 0.26 | -3.69 | 0.2086 | 0.2086 | |||
| OIH / VanEck ETF Trust - VanEck Oil Services ETF | 0.01 | 0.00 | 0.25 | 9.73 | 0.1982 | 0.0147 | |||
| MO / Altria Group, Inc. | 0.00 | -50.00 | 0.24 | -54.48 | 0.1950 | -0.2403 | |||
| INTC / Intel Corporation | 0.00 | -100.00 | 0.00 | -100.00 | 0.0000 | ||||
| BKNG / Booking Holdings Inc. | 0.00 | -100.00 | 0.00 | -100.00 | 0.0000 | ||||
| TGT / Target Corporation | 0.00 | -100.00 | 0.00 | -100.00 | -1.0836 | ||||
| HBI / Hanesbrands Inc. | 0.00 | -100.00 | 0.00 | -100.00 | 0.0000 |