Basic Stats
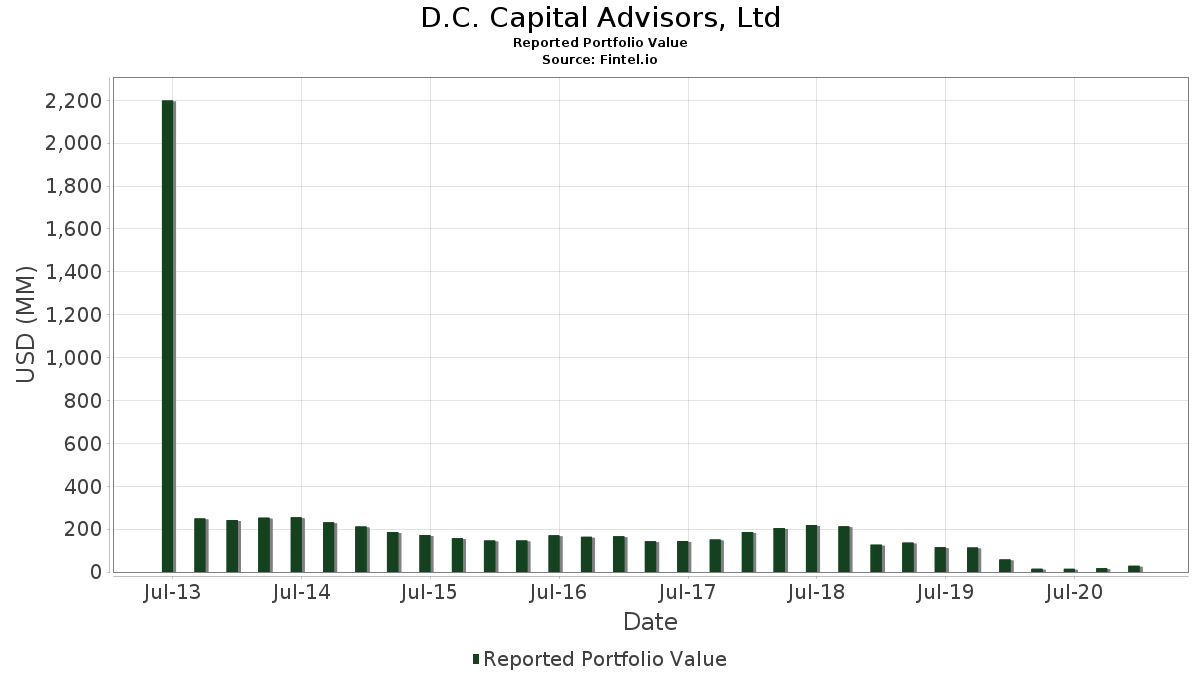
| Portfolio Value | $ 28,887,000 |
| Current Positions | 11 |
Latest Holdings, Performance, AUM (from 13F, 13D)
D.C. Capital Advisors, Ltd has disclosed 11 total holdings in their latest SEC filings. Most recent portfolio value is calculated to be $ 28,887,000 USD. Actual Assets Under Management (AUM) is this value plus cash (which is not disclosed). D.C. Capital Advisors, Ltd’s top holdings are Modine Manufacturing Company (US:MOD) , Superior Industries International, Inc. (US:SUP) , Commercial Vehicle Group, Inc. (US:CVGI) , Civeo Corporation (US:CVEO) , and Teck Resources Limited (US:TECK) .
Top Increases This Quarter
We use the change in the portfolio allocation because this is the most meaningful metric. Changes can be due to trades or changes in share prices.
| Security | Shares (MM) |
Value (MM$) |
Portfolio % | ΔPortfolio % |
|---|---|---|---|---|
| 1.20 | 4.91 | 16.9903 | 8.4893 | |
| 0.89 | 11.16 | 38.6471 | 3.2263 | |
| 0.10 | 1.53 | 5.2965 | 1.6751 | |
| 0.01 | 0.90 | 3.1121 | 0.3181 | |
| 0.03 | 0.24 | 0.8274 | 0.2266 |
Top Decreases This Quarter
We use the change in the portfolio allocation because this is the most meaningful metric. Changes can be due to trades or changes in share prices.
| Security | Shares (MM) |
Value (MM$) |
Portfolio % | ΔPortfolio % |
|---|---|---|---|---|
| 0.40 | 3.46 | 11.9777 | -6.5261 | |
| 0.01 | 1.59 | 5.4973 | -2.4030 | |
| 0.00 | 0.00 | -1.9042 | ||
| 0.20 | 2.78 | 9.6237 | -1.8526 | |
| 0.01 | 0.30 | 1.0316 | -0.7933 | |
| 0.00 | 0.00 | -0.3684 | ||
| 0.01 | 0.21 | 0.7131 | -0.0576 | |
| 0.10 | 1.81 | 6.2831 | -0.0303 |
13F and Fund Filings
This form was filed on 2021-02-12 for the reporting period 2020-12-31. Click the link icon to see the full transaction history.
Upgrade to unlock premium data and export to Excel ![]() .
.
| Security | Type | Avg Share Price | Shares (MM) |
ΔShares (%) |
ΔShares (%) |
Value ($MM) |
Portfolio (%) |
ΔPortfolio (%) |
|
|---|---|---|---|---|---|---|---|---|---|
| MOD / Modine Manufacturing Company | 0.89 | -11.11 | 11.16 | 78.62 | 38.6471 | 3.2263 | |||
| SUP / Superior Industries International, Inc. | 1.20 | 0.00 | 4.91 | 227.20 | 16.9903 | 8.4893 | |||
| CVGI / Commercial Vehicle Group, Inc. | 0.40 | -20.00 | 3.46 | 5.97 | 11.9777 | -6.5261 | |||
| CVEO / Civeo Corporation | 0.20 | -93.33 | 2.78 | 37.28 | 9.6237 | -1.8526 | |||
| TECK / Teck Resources Limited | 0.10 | 25.00 | 1.81 | 62.93 | 6.2831 | -0.0303 | |||
| LGIH / LGI Homes, Inc. | 0.01 | 25.00 | 1.59 | 13.92 | 5.4973 | -2.4030 | |||
| CHX / ChampionX Corporation | 0.10 | 25.00 | 1.53 | 139.44 | 5.2965 | 1.6751 | |||
| CHWY / Chewy, Inc. | 0.01 | 11.11 | 0.90 | 82.35 | 3.1121 | 0.3181 | |||
| GOOS / Canada Goose Holdings Inc. | 0.01 | 0.00 | 0.30 | -7.45 | 1.0316 | -0.7933 | |||
| OII / Oceaneering International, Inc. | 0.03 | 0.00 | 0.24 | 125.47 | 0.8274 | 0.2266 | |||
| NOV / NOV Inc. | 0.01 | 0.00 | 0.21 | 51.47 | 0.7131 | -0.0576 | |||
| TDW / Tidewater Inc. | 0.00 | -100.00 | 0.00 | -100.00 | -1.9042 | ||||
| HNRG / Hallador Energy Company | 0.00 | -100.00 | 0.00 | -100.00 | -0.3684 |