Basic Stats
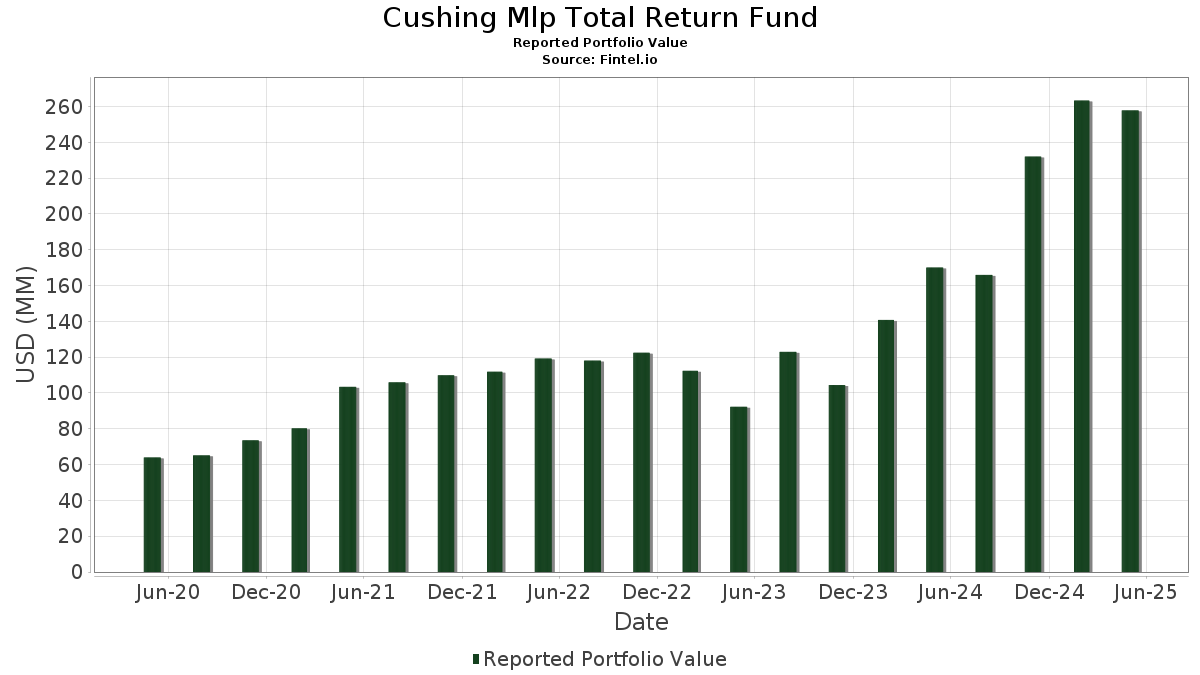
| Portfolio Value | $ 257,780,521 |
| Current Positions | 43 |
Latest Holdings, Performance, AUM (from 13F, 13D)
Cushing Mlp Total Return Fund has disclosed 43 total holdings in their latest SEC filings. Most recent portfolio value is calculated to be $ 257,780,521 USD. Actual Assets Under Management (AUM) is this value plus cash (which is not disclosed). Cushing Mlp Total Return Fund’s top holdings are Hess Midstream LP (US:HESM) , Energy Transfer LP - Limited Partnership (US:ET) , MPLX LP - Limited Partnership (US:MPLX) , ONEOK, Inc. (US:OKE) , and Cheniere Energy, Inc. (US:LNG) . Cushing Mlp Total Return Fund’s new positions include Strategy Inc (US:MSTR) , .
Top Increases This Quarter
We use the change in the portfolio allocation because this is the most meaningful metric. Changes can be due to trades or changes in share prices.
| Security | Shares (MM) |
Value (MM$) |
Portfolio % | ΔPortfolio % |
|---|---|---|---|---|
| 0.23 | 8.60 | 4.7652 | 4.6926 | |
| 0.20 | 3.69 | 2.0459 | 2.0459 | |
| 0.01 | 3.69 | 2.0440 | 2.0440 | |
| 0.40 | 14.80 | 8.1967 | 1.9566 | |
| 0.03 | 6.71 | 3.7155 | 1.7932 | |
| 0.04 | 2.90 | 1.6040 | 1.6040 | |
| 0.15 | 6.68 | 3.7002 | 1.4795 | |
| 0.02 | 7.04 | 3.8998 | 1.4475 | |
| 0.33 | 4.94 | 2.7342 | 1.3550 | |
| 0.10 | 2.20 | 1.2206 | 1.2206 |
Top Decreases This Quarter
We use the change in the portfolio allocation because this is the most meaningful metric. Changes can be due to trades or changes in share prices.
| Security | Shares (MM) |
Value (MM$) |
Portfolio % | ΔPortfolio % |
|---|---|---|---|---|
| 0.00 | 0.13 | 0.0713 | -4.6939 | |
| 0.08 | 12.63 | 6.9973 | -2.3262 | |
| 0.45 | 7.92 | 4.3864 | -1.9562 | |
| 0.00 | 0.00 | -1.6411 | ||
| 0.81 | 14.25 | 7.8900 | -1.5504 | |
| 0.05 | 12.92 | 7.1533 | -1.5466 | |
| 0.28 | 14.03 | 7.7675 | -1.3200 | |
| 0.17 | 6.47 | 3.5834 | -1.2711 | |
| 0.39 | 10.88 | 6.0254 | -0.9006 | |
| 0.17 | 8.86 | 4.9081 | -0.6874 |
13F and Fund Filings
This form was filed on 2025-07-30 for the reporting period 2025-05-31. Click the link icon to see the full transaction history.
Upgrade to unlock premium data and export to Excel ![]() .
.
| Security | Type | Avg Share Price | Shares (MM) |
ΔShares (%) |
ΔShares (%) |
Value ($MM) |
Portfolio (%) |
ΔPortfolio (%) |
|
|---|---|---|---|---|---|---|---|---|---|
| HESM / Hess Midstream LP | 0.40 | 45.45 | 14.80 | 28.98 | 8.1967 | 1.9566 | |||
| ET / Energy Transfer LP - Limited Partnership | 0.81 | -9.44 | 14.25 | -17.94 | 7.8900 | -1.5504 | |||
| MPLX / MPLX LP - Limited Partnership | 0.28 | -11.29 | 14.03 | -16.08 | 7.7675 | -1.3200 | |||
| OKE / ONEOK, Inc. | 0.17 | 21.43 | 13.74 | -2.22 | 7.6112 | -0.0312 | |||
| LNG / Cheniere Energy, Inc. | 0.05 | -22.14 | 12.92 | -19.28 | 7.1533 | -1.5466 | |||
| TRGP / Targa Resources Corp. | 0.08 | -5.88 | 12.63 | -26.32 | 6.9973 | -2.3262 | |||
| WMB / The Williams Companies, Inc. | 0.18 | -12.20 | 10.89 | -8.68 | 6.0322 | -0.4532 | |||
| KMI / Kinder Morgan, Inc. | 0.39 | -17.45 | 10.88 | -14.59 | 6.0254 | -0.9006 | |||
| DTM / DT Midstream, Inc. | 0.09 | -6.00 | 9.85 | 2.46 | 5.4528 | 0.2277 | |||
| FGXXX / First American Funds Inc - First American Government Obligations Fund Class X | 8.86 | -5.01 | 8.86 | -5.01 | 4.9081 | -0.1650 | |||
| FXFXX / First American Funds Inc - First American Treasury Obligations Fund Class X | 8.86 | -5.01 | 8.86 | -5.01 | 4.9081 | -0.1650 | |||
| TRP / TC Energy Corporation | 0.17 | -23.91 | 8.86 | -13.88 | 4.9081 | -0.6874 | |||
| PPL / Pembina Pipeline Corporation | 0.23 | 6,583.11 | 8.60 | 6,369.17 | 4.7652 | 4.6926 | |||
| PAGP / Plains GP Holdings, L.P. - Limited Partnership | 0.45 | -16.67 | 7.92 | -32.10 | 4.3864 | -1.9562 | |||
| CEG / Constellation Energy Corporation | 0.02 | 27.78 | 7.04 | 56.15 | 3.8998 | 1.4475 | |||
| VST / Vistra Corp. | 0.04 | -18.87 | 6.90 | -2.53 | 3.8239 | -0.0281 | |||
| TLN / Talen Energy Corporation | 0.03 | 61.76 | 6.71 | 89.76 | 3.7155 | 1.7932 | |||
| ALTM / Arcadium Lithium plc | 0.15 | 114.29 | 6.68 | 63.63 | 3.7002 | 1.4795 | |||
| WES / Western Midstream Partners, LP - Limited Partnership | 0.17 | -21.36 | 6.47 | -27.52 | 3.5834 | -1.2711 | |||
| GEV / GE Vernova Inc. | 0.01 | 0.00 | 5.68 | 41.10 | 3.1434 | 0.9563 | |||
| EPD / Enterprise Products Partners L.P. - Limited Partnership | 0.18 | -4.21 | 5.61 | -11.63 | 3.1066 | -0.3452 | |||
| EQT / EQT Corporation | 0.10 | -5.00 | 5.24 | 8.72 | 2.9006 | 0.2813 | |||
| ARLP / Alliance Resource Partners, L.P. - Limited Partnership | 0.19 | -4.50 | 4.97 | -5.28 | 2.7535 | -0.1002 | |||
| TXO / TXO Partners, L.P. | 0.33 | 153.85 | 4.94 | 94.64 | 2.7342 | 1.3550 | |||
| PSX / Phillips 66 | 0.04 | 0.00 | 4.54 | -12.49 | 2.5140 | -0.3069 | |||
| VNOM / Viper Energy, Inc. | 0.10 | 0.00 | 3.97 | -14.77 | 2.1982 | -0.3342 | |||
| CVE / Cenovus Energy Inc. | 0.30 | 0.00 | 3.95 | -4.77 | 2.1899 | -0.0679 | |||
| BE / Bloom Energy Corporation | 0.20 | 3.69 | 2.0459 | 2.0459 | |||||
| MSTR / Strategy Inc | 0.01 | 3.69 | 2.0440 | 2.0440 | |||||
| SOBO / South Bow Corporation | 0.14 | 70.28 | 3.54 | 69.91 | 1.9616 | 0.8926 | |||
| NEE / NextEra Energy, Inc. | 0.04 | 2.90 | 1.6040 | 1.6040 | |||||
| KEY / Keyera Corp. | 0.09 | 0.00 | 2.74 | 3.94 | 1.5193 | 0.0840 | |||
| PWR / Quanta Services, Inc. | 0.01 | 0.00 | 2.74 | 31.92 | 1.5178 | 0.3883 | |||
| ARIS / Aris Water Solutions, Inc. | 0.10 | 2.20 | 1.2206 | 1.2206 | |||||
| FSLR / First Solar, Inc. | 0.01 | 0.00 | 2.06 | 16.10 | 1.1381 | 0.1755 | |||
| GEL / Genesis Energy, L.P. - Limited Partnership | 0.13 | -13.33 | 2.05 | -1.39 | 1.1354 | -0.4769 | |||
| NEE.PRN / NextEra Energy Capital Holdings, Inc. - Corporate Bond/Note | 0.08 | 0.00 | 1.81 | -4.80 | 1.0004 | -0.0316 | |||
| NGL.PRC / NGL Energy Partners LP - Preferred Stock | 0.02 | 0.00 | 0.44 | -8.88 | 0.2446 | -0.0188 | |||
| PPL / Pembina Pipeline Corporation | 0.00 | -98.50 | 0.13 | -98.51 | 0.0713 | -4.6939 | |||
| VG / Venture Global, Inc. | 0.00 | -100.00 | 0.00 | -100.00 | -1.6411 | ||||
| MicroStrategy Inc / DE (N/A) | -0.00 | -0.0001 | -0.0001 | ||||||
| Vistra Corp / DE (N/A) | -0.00 | -0.0002 | -0.0002 | ||||||
| First Solar Inc / DE (N/A) | -0.00 | -0.0003 | -0.0003 | ||||||
| Constellation Energy Corp / DE (N/A) | -0.00 | -0.0006 | -0.0006 |