Basic Stats
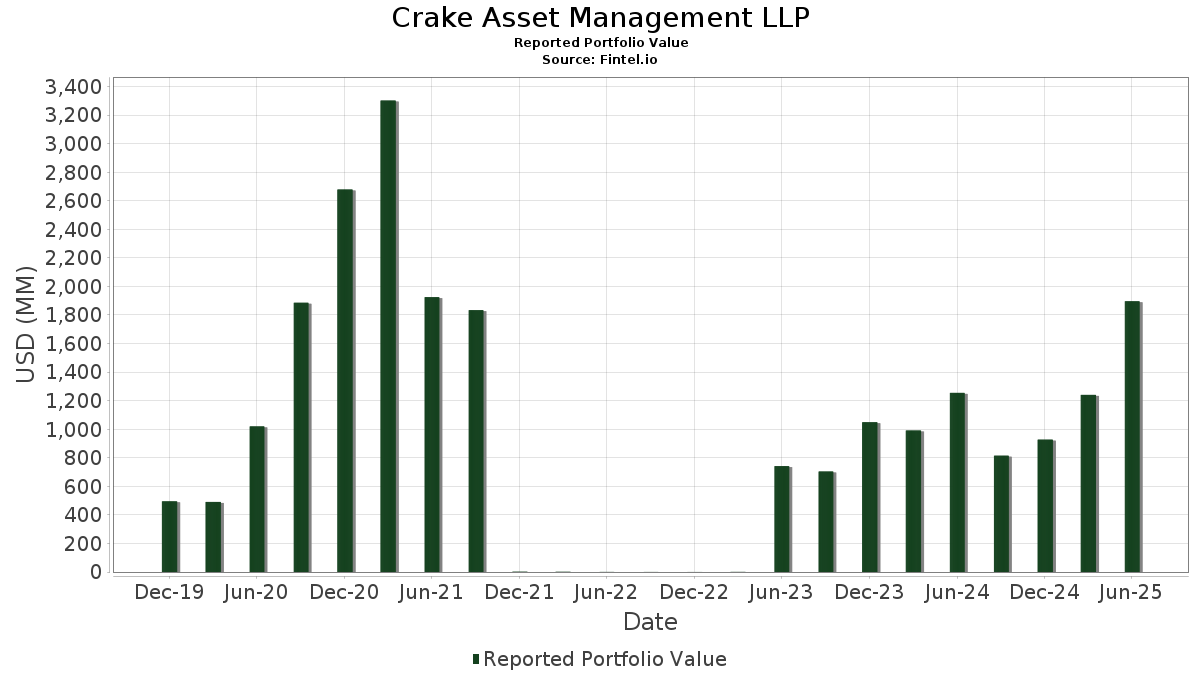
| Portfolio Value | $ 1,896,132,376 |
| Current Positions | 18 |
Latest Holdings, Performance, AUM (from 13F, 13D)
Crake Asset Management LLP has disclosed 18 total holdings in their latest SEC filings. Most recent portfolio value is calculated to be $ 1,896,132,376 USD. Actual Assets Under Management (AUM) is this value plus cash (which is not disclosed). Crake Asset Management LLP’s top holdings are Freeport-McMoRan Inc. (US:FCX) , Amazon.com, Inc. (US:AMZN) , T-Mobile US, Inc. (US:TMUS) , NVIDIA Corporation (US:NVDA) , and Alphabet Inc. (US:GOOG) . Crake Asset Management LLP’s new positions include Humana Inc. (US:HUM) , .
Top Increases This Quarter
We use the change in the portfolio allocation because this is the most meaningful metric. Changes can be due to trades or changes in share prices.
| Security | Shares (MM) |
Value (MM$) |
Portfolio % | ΔPortfolio % |
|---|---|---|---|---|
| 0.68 | 160.94 | 8.4880 | 8.4880 | |
| 1.37 | 301.55 | 15.9035 | 5.5268 | |
| 0.43 | 87.81 | 4.6312 | 4.6312 | |
| 9.52 | 412.81 | 21.7710 | 3.6722 | |
| 0.84 | 149.63 | 7.8915 | 2.7586 | |
| 1.29 | 41.98 | 2.2137 | 2.2137 | |
| 0.17 | 40.82 | 2.1526 | 2.1526 | |
| 1.10 | 52.05 | 2.7452 | 2.0387 | |
| 0.11 | 35.55 | 1.8747 | 1.8747 | |
| 1.04 | 33.74 | 1.7793 | 1.7793 |
Top Decreases This Quarter
We use the change in the portfolio allocation because this is the most meaningful metric. Changes can be due to trades or changes in share prices.
| Security | Shares (MM) |
Value (MM$) |
Portfolio % | ΔPortfolio % |
|---|---|---|---|---|
| 0.29 | 143.34 | 7.5595 | -23.0547 | |
| 0.59 | 72.22 | 3.8090 | -2.7477 | |
| 0.53 | 64.46 | 3.3995 | -2.0991 | |
| 0.09 | 27.12 | 1.4305 | -0.8525 | |
| 0.07 | 53.14 | 2.8027 | -0.5429 | |
| 0.31 | 38.82 | 2.0471 | -0.4435 | |
| 0.39 | 30.38 | 1.6020 | -0.3461 |
13F and Fund Filings
This form was filed on 2025-08-13 for the reporting period 2025-06-30. Click the link icon to see the full transaction history.
Upgrade to unlock premium data and export to Excel ![]() .
.
| Security | Type | Avg Share Price | Shares (MM) |
ΔShares (%) |
ΔShares (%) |
Value ($MM) |
Portfolio (%) |
ΔPortfolio (%) |
|
|---|---|---|---|---|---|---|---|---|---|
| FCX / Freeport-McMoRan Inc. | 9.52 | 60.59 | 412.81 | 83.88 | 21.7710 | 3.6722 | |||
| AMZN / Amazon.com, Inc. | 1.37 | 103.18 | 301.55 | 134.29 | 15.9035 | 5.5268 | |||
| TMUS / T-Mobile US, Inc. | 0.68 | 160.94 | 8.4880 | 8.4880 | |||||
| NVDA / NVIDIA Corporation | 0.95 | 26.74 | 149.77 | 84.75 | 7.8989 | 1.3632 | |||
| GOOG / Alphabet Inc. | 0.84 | 106.99 | 149.63 | 135.02 | 7.8915 | 2.7586 | |||
| MSFT / Microsoft Corporation | 0.29 | -71.51 | 143.34 | -62.25 | 7.5595 | -23.0547 | |||
| AAPL / Apple Inc. | 0.43 | 87.81 | 4.6312 | 4.6312 | |||||
| MU / Micron Technology, Inc. | 0.59 | -37.39 | 72.22 | -11.20 | 3.8090 | -2.7477 | |||
| DELL / Dell Technologies Inc. | 0.53 | -29.73 | 64.46 | -5.49 | 3.3995 | -2.0991 | |||
| META / Meta Platforms, Inc. | 0.07 | 0.00 | 53.14 | 28.06 | 2.8027 | -0.5429 | |||
| BAC / Bank of America Corporation | 1.10 | 423.81 | 52.05 | 494.00 | 2.7452 | 2.0387 | |||
| JD / JD.com, Inc. - Depositary Receipt (Common Stock) | 1.29 | 41.98 | 2.2137 | 2.2137 | |||||
| HUM / Humana Inc. | 0.17 | 40.82 | 2.1526 | 2.1526 | |||||
| DIS / The Walt Disney Company | 0.31 | 0.00 | 38.82 | 25.64 | 2.0471 | -0.4435 | |||
| UNH / UnitedHealth Group Incorporated | 0.11 | 35.55 | 1.8747 | 1.8747 | |||||
| LUV / Southwest Airlines Co. | 1.04 | 33.74 | 1.7793 | 1.7793 | |||||
| MRVL / Marvell Technology, Inc. | 0.39 | 0.00 | 30.38 | 25.71 | 1.6020 | -0.3461 | |||
| ACN / Accenture plc | 0.09 | 0.00 | 27.12 | -4.21 | 1.4305 | -0.8525 | |||
| ORCL / Oracle Corporation | 0.00 | -100.00 | 0.00 | 0.0000 | |||||
| DHI / D.R. Horton, Inc. | 0.00 | -100.00 | 0.00 | 0.0000 | |||||
| AMD / Advanced Micro Devices, Inc. | 0.00 | -100.00 | 0.00 | 0.0000 |