Basic Stats
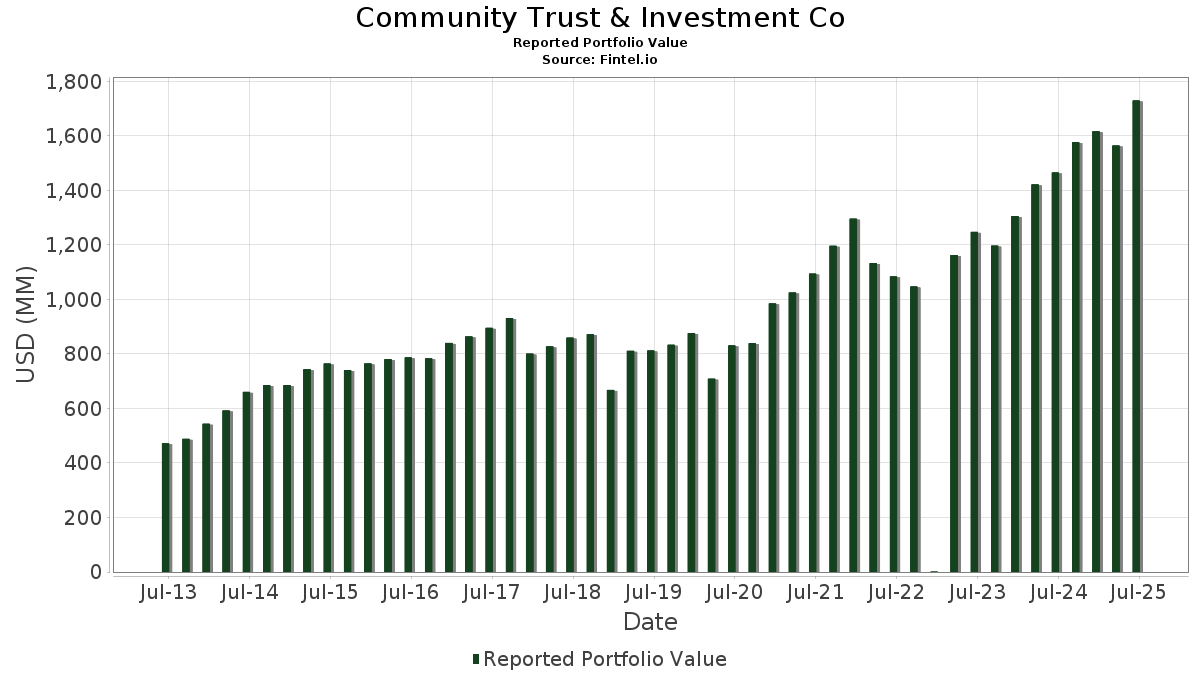
| Portfolio Value | $ 1,729,047,135 |
| Current Positions | 134 |
Latest Holdings, Performance, AUM (from 13F, 13D)
Community Trust & Investment Co has disclosed 134 total holdings in their latest SEC filings. Most recent portfolio value is calculated to be $ 1,729,047,135 USD. Actual Assets Under Management (AUM) is this value plus cash (which is not disclosed). Community Trust & Investment Co’s top holdings are Microsoft Corporation (US:MSFT) , NVIDIA Corporation (US:NVDA) , Community Trust Bancorp, Inc. (US:CTBI) , Apple Inc. (US:AAPL) , and Amazon.com, Inc. (US:AMZN) . Community Trust & Investment Co’s new positions include Cummins Inc. (US:CMI) , iShares Trust - iShares CMBS ETF (US:CMBS) , iShares Trust - iShares Core U.S. Aggregate Bond ETF (US:AGG) , .
Top Increases This Quarter
We use the change in the portfolio allocation because this is the most meaningful metric. Changes can be due to trades or changes in share prices.
| Security | Shares (MM) |
Value (MM$) |
Portfolio % | ΔPortfolio % |
|---|---|---|---|---|
| 0.06 | 47.10 | 2.7238 | 0.6092 | |
| 0.26 | 25.80 | 1.4920 | 0.3291 | |
| 0.16 | 22.17 | 1.2821 | 0.2850 | |
| 0.01 | 3.39 | 0.1959 | 0.1959 | |
| 0.20 | 19.00 | 1.0991 | 0.1671 | |
| 0.17 | 48.24 | 2.7902 | 0.1400 | |
| 0.05 | 5.49 | 0.3173 | 0.0511 | |
| 0.02 | 0.80 | 0.0460 | 0.0460 | |
| 0.03 | 3.21 | 0.1855 | 0.0264 | |
| 0.20 | 20.56 | 1.1890 | 0.0262 |
Top Decreases This Quarter
We use the change in the portfolio allocation because this is the most meaningful metric. Changes can be due to trades or changes in share prices.
| Security | Shares (MM) |
Value (MM$) |
Portfolio % | ΔPortfolio % |
|---|---|---|---|---|
| 1.98 | 104.73 | 2.2469 | -3.9389 | |
| 0.22 | 111.52 | 2.3925 | -3.3101 | |
| 0.34 | 75.11 | 1.6114 | -2.5470 | |
| 0.40 | 71.69 | 1.5380 | -2.5108 | |
| 0.68 | 107.41 | 2.3044 | -1.9949 | |
| 0.21 | 57.34 | 1.2301 | -1.4377 | |
| 0.04 | 20.65 | 0.4430 | -1.0032 | |
| 0.31 | 25.07 | 0.5379 | -0.9914 | |
| 0.25 | 22.30 | 0.4785 | -0.9729 | |
| 0.13 | 20.38 | 0.4373 | -0.9550 |
13F and Fund Filings
This form was filed on 2025-07-10 for the reporting period 2025-06-30. Click the link icon to see the full transaction history.
Upgrade to unlock premium data and export to Excel ![]() .
.
| Security | Type | Avg Share Price | Shares (MM) |
ΔShares (%) |
ΔShares (%) |
Value ($MM) |
Portfolio (%) |
ΔPortfolio (%) |
|
|---|---|---|---|---|---|---|---|---|---|
| MSFT / Microsoft Corporation | 0.22 | -5.63 | 111.52 | 25.05 | 2.3925 | -3.3101 | |||
| NVDA / NVIDIA Corporation | 0.68 | 9.59 | 107.41 | 59.76 | 2.3044 | -1.9949 | |||
| CTBI / Community Trust Bancorp, Inc. | 1.98 | 3.03 | 104.73 | 8.26 | 2.2469 | -3.9389 | |||
| AAPL / Apple Inc. | 0.38 | 4.60 | 78.68 | -3.38 | 4.5504 | -0.6568 | |||
| AMZN / Amazon.com, Inc. | 0.34 | 0.16 | 75.11 | 15.50 | 1.6114 | -2.5470 | |||
| GOOG / Alphabet Inc. | 0.40 | -0.28 | 71.69 | 13.22 | 1.5380 | -2.5108 | |||
| AVGO / Broadcom Inc. | 0.21 | -16.52 | 57.34 | 37.43 | 1.2301 | -1.4377 | |||
| JPM / JPMorgan Chase & Co. | 0.17 | -1.51 | 48.24 | 16.41 | 2.7902 | 0.1400 | |||
| META / Meta Platforms, Inc. | 0.06 | 11.21 | 47.10 | 42.42 | 2.7238 | 0.6092 | |||
| V / Visa Inc. | 0.11 | -0.88 | 40.13 | 0.42 | 2.3212 | -0.2345 | |||
| WMT / Walmart Inc. | 0.30 | -2.92 | 29.01 | 8.12 | 1.6779 | -0.0379 | |||
| PH / Parker-Hannifin Corporation | 0.04 | 0.67 | 27.93 | 15.67 | 0.5992 | -0.9447 | |||
| CRM / Salesforce, Inc. | 0.10 | 10.43 | 26.59 | 12.21 | 0.5705 | -0.9448 | |||
| LIN / Linde plc | 0.06 | 0.28 | 26.47 | 1.04 | 1.5309 | -0.1443 | |||
| LNG / Cheniere Energy, Inc. | 0.11 | -11.87 | 26.09 | -7.25 | 1.5087 | -0.2898 | |||
| APH / Amphenol Corporation | 0.26 | -5.78 | 25.80 | 41.86 | 1.4920 | 0.3291 | |||
| MTZ / MasTec, Inc. | 0.15 | -8.86 | 25.31 | 33.09 | 0.5429 | -0.6729 | |||
| XLU / The Select Sector SPDR Trust - The Utilities Select Sector SPDR Fund | 0.31 | 1.23 | 25.07 | 4.83 | 0.5379 | -0.9914 | |||
| PANW / Palo Alto Networks, Inc. | 0.12 | -9.08 | 24.26 | 9.03 | 0.5204 | -0.9022 | |||
| VGSN.X / Vanguard Specialized Funds - Vanguard Real Estate ETF | 0.25 | -0.11 | 22.30 | -1.74 | 0.4785 | -0.9729 | |||
| AMD / Advanced Micro Devices, Inc. | 0.16 | 2.93 | 22.17 | 42.16 | 1.2821 | 0.2850 | |||
| BRK.B / Berkshire Hathaway Inc. | 0.04 | 0.10 | 20.65 | -8.70 | 0.4430 | -1.0032 | |||
| CHDN / Churchill Downs Incorporated | 0.20 | 24.32 | 20.56 | 13.06 | 1.1890 | 0.0262 | |||
| PG / The Procter & Gamble Company | 0.13 | 0.14 | 20.38 | -6.39 | 0.4373 | -0.9550 | |||
| KKR / KKR & Co. Inc. | 0.15 | 1.35 | 20.15 | 16.62 | 0.4322 | -0.6725 | |||
| ICE / Intercontinental Exchange, Inc. | 0.11 | -12.95 | 19.97 | -7.41 | 1.1548 | -0.2242 | |||
| TJX / The TJX Companies, Inc. | 0.16 | -2.22 | 19.65 | -0.86 | 0.4215 | -0.8457 | |||
| RTX / RTX Corporation | 0.13 | -0.38 | 19.51 | 9.82 | 0.4186 | -0.7175 | |||
| UNH / UnitedHealth Group Incorporated | 0.06 | 4.22 | 19.24 | -37.93 | 1.1129 | -0.8693 | |||
| UBER / Uber Technologies, Inc. | 0.20 | 1.82 | 19.00 | 30.39 | 1.0991 | 0.1671 | |||
| TMO / Thermo Fisher Scientific Inc. | 0.05 | 34.90 | 18.57 | 9.92 | 0.3983 | -0.6818 | |||
| LLY / Eli Lilly and Company | 0.02 | 35.27 | 18.39 | 27.68 | 0.3945 | -0.5264 | |||
| CVS / CVS Health Corporation | 0.26 | -1.67 | 18.04 | 0.12 | 1.0433 | -0.1089 | |||
| IQV / IQVIA Holdings Inc. | 0.11 | 42.81 | 17.88 | 27.65 | 0.3835 | -0.5120 | |||
| USFD / US Foods Holding Corp. | 0.23 | 0.40 | 17.82 | 18.11 | 0.3823 | -0.5825 | |||
| KEYS / Keysight Technologies, Inc. | 0.11 | -5.59 | 17.57 | 3.30 | 1.0162 | -0.0715 | |||
| ZTS / Zoetis Inc. | 0.11 | 1.53 | 17.22 | -3.84 | 0.9957 | -0.1491 | |||
| EQH / Equitable Holdings, Inc. | 0.29 | -7.70 | 16.52 | -0.60 | 0.3544 | -0.7082 | |||
| BSX / Boston Scientific Corporation | 0.15 | -15.35 | 16.32 | -9.87 | 0.3502 | -0.8078 | |||
| COST / Costco Wholesale Corporation | 0.02 | -13.17 | 15.99 | -9.12 | 0.9248 | -0.2002 | |||
| TMUS / T-Mobile US, Inc. | 0.07 | 2.85 | 15.85 | -8.12 | 0.9170 | -0.1864 | |||
| AZN / AstraZeneca PLC - Depositary Receipt (Common Stock) | 0.23 | 21.15 | 15.80 | 15.19 | 0.3391 | -0.5383 | |||
| LHX / L3Harris Technologies, Inc. | 0.06 | -4.34 | 15.66 | 14.64 | 0.3359 | -0.5374 | |||
| CVX / Chevron Corporation | 0.10 | -13.65 | 14.77 | -26.09 | 0.8543 | -0.4236 | |||
| SPGI / S&P Global Inc. | 0.03 | 3.25 | 14.58 | 7.15 | 0.8430 | -0.0269 | |||
| SLB / Schlumberger Limited | 0.41 | 6.60 | 13.84 | -13.80 | 0.8002 | -0.2262 | |||
| HCA / HCA Healthcare, Inc. | 0.04 | -11.67 | 13.76 | -2.07 | 0.2952 | -0.6033 | |||
| GTLS / Chart Industries, Inc. | 0.08 | 1.55 | 13.08 | 15.82 | 0.2807 | -0.4416 | |||
| SHW / The Sherwin-Williams Company | 0.04 | 1.24 | 12.87 | -0.46 | 0.7443 | -0.0824 | |||
| LOW / Lowe's Companies, Inc. | 0.06 | -0.70 | 12.23 | -5.53 | 0.7072 | -0.1205 | |||
| GVI / iShares Trust - iShares Intermediate Government/Credit Bond ETF | 0.11 | 30.72 | 11.74 | 31.67 | 0.2518 | -0.3182 | |||
| MDLZ / Mondelez International, Inc. | 0.17 | 1.66 | 11.33 | 1.04 | 0.6554 | -0.0617 | |||
| NKE / NIKE, Inc. | 0.15 | 1.66 | 10.62 | 13.77 | 0.6141 | 0.0173 | |||
| PAAA / PGIM ETF Trust - PGIM AAA CLO ETF | 0.19 | -0.79 | 10.02 | -0.52 | 0.2150 | -0.4290 | |||
| MBB / iShares Trust - iShares MBS ETF | 0.10 | 3.34 | 9.81 | 3.46 | 0.2105 | -0.3959 | |||
| CMG / Chipotle Mexican Grill, Inc. | 0.16 | 5.99 | 9.21 | 18.54 | 0.1977 | -0.2994 | |||
| NEE / NextEra Energy, Inc. | 0.12 | 1.77 | 8.66 | -0.33 | 0.1857 | -0.3697 | |||
| PLD / Prologis, Inc. | 0.07 | 3.37 | 7.66 | -2.79 | 0.1643 | -0.3395 | |||
| PEBO / Peoples Bancorp Inc. | 0.18 | 0.00 | 5.56 | 2.98 | 0.1192 | -0.2259 | |||
| IEI / iShares Trust - iShares 3-7 Year Treasury Bond ETF | 0.05 | 30.73 | 5.49 | 31.81 | 0.3173 | 0.0511 | |||
| HD / The Home Depot, Inc. | 0.01 | 10.24 | 5.16 | 10.27 | 0.1108 | -0.1886 | |||
| UNP / Union Pacific Corporation | 0.02 | 14.82 | 4.22 | 11.83 | 0.2443 | 0.0028 | |||
| PM / Philip Morris International Inc. | 0.02 | -25.63 | 3.93 | -14.67 | 0.0844 | -0.2104 | |||
| ABBV / AbbVie Inc. | 0.02 | -1.31 | 3.93 | -12.56 | 0.0843 | -0.2030 | |||
| HON / Honeywell International Inc. | 0.02 | -3.68 | 3.91 | 5.93 | 0.0839 | -0.1521 | |||
| BX / Blackstone Inc. | 0.02 | 0.34 | 3.67 | 7.37 | 0.0788 | -0.1399 | |||
| MS / Morgan Stanley | 0.03 | -18.57 | 3.66 | -1.69 | 0.0784 | -0.1593 | |||
| KO / The Coca-Cola Company | 0.05 | -0.77 | 3.60 | -1.96 | 0.0773 | -0.1577 | |||
| MET / MetLife, Inc. | 0.04 | 0.42 | 3.44 | 0.59 | 0.0737 | -0.1448 | |||
| ADC / Agree Realty Corporation | 0.05 | -1.50 | 3.40 | -6.78 | 0.0729 | -0.1601 | |||
| CMI / Cummins Inc. | 0.01 | 3.39 | 0.1959 | 0.1959 | |||||
| AMT / American Tower Corporation | 0.02 | -0.41 | 3.36 | 1.14 | 0.0721 | -0.1402 | |||
| ARCC / Ares Capital Corporation | 0.15 | 0.30 | 3.30 | -0.60 | 0.0707 | -0.1413 | |||
| MCD / McDonald's Corporation | 0.01 | -0.58 | 3.29 | -7.01 | 0.1902 | -0.0359 | |||
| MDT / Medtronic plc | 0.04 | -0.05 | 3.27 | -3.06 | 0.1889 | -0.0265 | |||
| MRK / Merck & Co., Inc. | 0.04 | 0.49 | 3.25 | -11.38 | 0.1878 | -0.0465 | |||
| FITB / Fifth Third Bancorp | 0.08 | 1.87 | 3.23 | 6.87 | 0.1871 | -0.0064 | |||
| RHP / Ryman Hospitality Properties, Inc. | 0.03 | 19.48 | 3.21 | 28.91 | 0.1855 | 0.0264 | |||
| VICI / VICI Properties Inc. | 0.10 | -0.02 | 3.21 | -0.06 | 0.0688 | -0.1364 | |||
| AMGN / Amgen Inc. | 0.01 | 1.93 | 3.15 | -8.67 | 0.0676 | -0.1530 | |||
| NI / NiSource Inc. | 0.08 | -0.20 | 3.14 | 0.42 | 0.1813 | -0.0183 | |||
| BP / BP p.l.c. - Depositary Receipt (Common Stock) | 0.10 | 12.54 | 3.11 | -0.32 | 0.0668 | -0.1329 | |||
| AES / The AES Corporation | 0.29 | -0.09 | 3.06 | -15.39 | 0.1771 | -0.0543 | |||
| CMCSA / Comcast Corporation | 0.08 | 2.04 | 2.95 | -1.30 | 0.0634 | -0.1280 | |||
| VLO / Valero Energy Corporation | 0.02 | 1.74 | 2.91 | 3.56 | 0.0624 | -0.1172 | |||
| QCOM / QUALCOMM Incorporated | 0.02 | 0.93 | 2.82 | 4.63 | 0.0606 | -0.1119 | |||
| PFE / Pfizer Inc. | 0.12 | -2.81 | 2.79 | -7.04 | 0.1613 | -0.0305 | |||
| GSIE / Goldman Sachs ETF Trust - Goldman Sachs ActiveBeta International Equity ETF | 0.06 | 0.00 | 2.47 | 11.26 | 0.0530 | -0.0890 | |||
| NSC / Norfolk Southern Corporation | 0.01 | 0.00 | 2.14 | 8.08 | 0.1239 | -0.0029 | |||
| IVV / iShares Trust - iShares Core S&P 500 ETF | 0.00 | 11.03 | 2.06 | 22.67 | 0.0443 | -0.0633 | |||
| DIA / SPDR Dow Jones Industrial Average ETF Trust | 0.00 | 0.00 | 1.74 | 5.01 | 0.1007 | -0.0054 | |||
| TFC / Truist Financial Corporation | 0.02 | 0.00 | 1.06 | 4.54 | 0.0227 | -0.0421 | |||
| GOOGL / Alphabet Inc. | 0.01 | -0.43 | 0.90 | 13.40 | 0.0193 | -0.0313 | |||
| CSX / CSX Corporation | 0.03 | 0.33 | 0.90 | 11.18 | 0.0192 | -0.0323 | |||
| JNJ / Johnson & Johnson | 0.01 | -0.48 | 0.82 | -8.25 | 0.0476 | -0.0098 | |||
| XLE / The Select Sector SPDR Trust - The Energy Select Sector SPDR Fund | 0.01 | 0.00 | 0.81 | -9.22 | 0.0173 | -0.0396 | |||
| CMBS / iShares Trust - iShares CMBS ETF | 0.02 | 0.80 | 0.0460 | 0.0460 | |||||
| FDVV / Fidelity Covington Trust - Fidelity High Dividend ETF | 0.01 | -10.79 | 0.73 | -6.54 | 0.0157 | -0.0342 | |||
| VYM / Vanguard Whitehall Funds - Vanguard High Dividend Yield ETF | 0.01 | -8.92 | 0.70 | -5.80 | 0.0150 | -0.0324 | |||
| XOM / Exxon Mobil Corporation | 0.01 | -3.25 | 0.61 | -12.37 | 0.0131 | -0.0314 | |||
| PEP / PepsiCo, Inc. | 0.00 | 0.00 | 0.58 | -11.82 | 0.0125 | -0.0298 | |||
| FAST / Fastenal Company | 0.01 | 100.00 | 0.57 | 8.32 | 0.0123 | -0.0216 | |||
| ARLP / Alliance Resource Partners, L.P. - Limited Partnership | 0.02 | 0.00 | 0.55 | -4.20 | 0.0118 | -0.0249 | |||
| UPS / United Parcel Service, Inc. | 0.01 | 0.00 | 0.53 | -8.26 | 0.0114 | -0.0257 | |||
| USMV / iShares Trust - iShares MSCI USA Min Vol Factor ETF | 0.01 | 0.00 | 0.51 | 0.20 | 0.0294 | -0.0030 | |||
| AEP / American Electric Power Company, Inc. | 0.00 | 46.21 | 0.47 | 38.82 | 0.0101 | -0.0116 | |||
| TFLO / iShares Trust - iShares Treasury Floating Rate Bond ETF | 0.01 | 0.00 | 0.46 | 0.00 | 0.0100 | -0.0197 | |||
| EFA / iShares Trust - iShares MSCI EAFE ETF | 0.01 | 0.00 | 0.46 | 9.46 | 0.0099 | -0.0172 | |||
| ABT / Abbott Laboratories | 0.00 | 1.16 | 0.45 | 3.70 | 0.0260 | -0.0017 | |||
| LPX / Louisiana-Pacific Corporation | 0.01 | 0.00 | 0.44 | -6.53 | 0.0095 | -0.0209 | |||
| CSCO / Cisco Systems, Inc. | 0.01 | 0.00 | 0.43 | 12.44 | 0.0252 | 0.0004 | |||
| WFC / Wells Fargo & Company | 0.01 | 3.86 | 0.43 | 16.03 | 0.0247 | 0.0011 | |||
| MO / Altria Group, Inc. | 0.01 | 0.00 | 0.41 | -2.36 | 0.0089 | -0.0182 | |||
| GE / General Electric Company | 0.00 | 0.00 | 0.40 | 28.94 | 0.0086 | -0.0113 | |||
| ORCL / Oracle Corporation | 0.00 | 0.00 | 0.38 | 56.56 | 0.0221 | 0.0065 | |||
| BAC / Bank of America Corporation | 0.01 | 3.44 | 0.38 | 17.45 | 0.0081 | -0.0125 | |||
| CAT / Caterpillar Inc. | 0.00 | -8.04 | 0.36 | 8.33 | 0.0078 | -0.0137 | |||
| LMT / Lockheed Martin Corporation | 0.00 | 0.00 | 0.36 | 3.79 | 0.0206 | -0.0014 | |||
| AGG / iShares Trust - iShares Core U.S. Aggregate Bond ETF | 0.00 | 0.34 | 0.0195 | 0.0195 | |||||
| VBIL / Vanguard Institutional Index Fund - 0-3 Months Treasury Bill ETF | 0.00 | 29.30 | 0.33 | 29.30 | 0.0071 | -0.0093 | |||
| DGRO / iShares Trust - iShares Core Dividend Growth ETF | 0.00 | -10.22 | 0.31 | -7.14 | 0.0067 | -0.0148 | |||
| T / AT&T Inc. | 0.01 | -1.82 | 0.31 | 0.32 | 0.0180 | -0.0018 | |||
| USB / U.S. Bancorp | 0.01 | -2.52 | 0.27 | 4.23 | 0.0157 | -0.0009 | |||
| GSSC / Goldman Sachs ETF Trust - Goldman Sachs ActiveBeta U.S. Small Cap Equity ETF | 0.00 | 0.00 | 0.27 | 8.16 | 0.0057 | -0.0100 | |||
| PGR / The Progressive Corporation | 0.00 | 0.00 | 0.26 | -5.51 | 0.0055 | -0.0119 | |||
| WY / Weyerhaeuser Company | 0.01 | 0.00 | 0.25 | -12.41 | 0.0053 | -0.0127 | |||
| VTSM.X / Vanguard Index Funds - Vanguard Total Stock Market ETF | 0.00 | 0.00 | 0.24 | 10.85 | 0.0050 | -0.0086 | |||
| WELL / Welltower Inc. | 0.00 | 0.00 | 0.23 | 0.43 | 0.0135 | -0.0014 | |||
| PNC / The PNC Financial Services Group, Inc. | 0.00 | 0.08 | 0.23 | 5.96 | 0.0050 | -0.0090 | |||
| EMR / Emerson Electric Co. | 0.00 | 0.22 | 0.0047 | 0.0047 | |||||
| XLRE / The Select Sector SPDR Trust - The Real Estate Select Sector SPDR Fund | 0.01 | 0.00 | 0.21 | -0.93 | 0.0046 | -0.0092 | |||
| ET / Energy Transfer LP - Limited Partnership | 0.01 | 8.00 | 0.20 | 5.35 | 0.0042 | -0.0077 | |||
| FGBI / First Guaranty Bancshares, Inc. | 0.02 | 0.00 | 0.14 | 6.77 | 0.0083 | -0.0003 | |||
| KFFB / Kentucky First Federal Bancorp | 0.02 | 0.00 | 0.06 | -3.12 | 0.0014 | -0.0028 | |||
| DG / Dollar General Corporation | 0.00 | -100.00 | 0.00 | 0.0000 |