Basic Stats
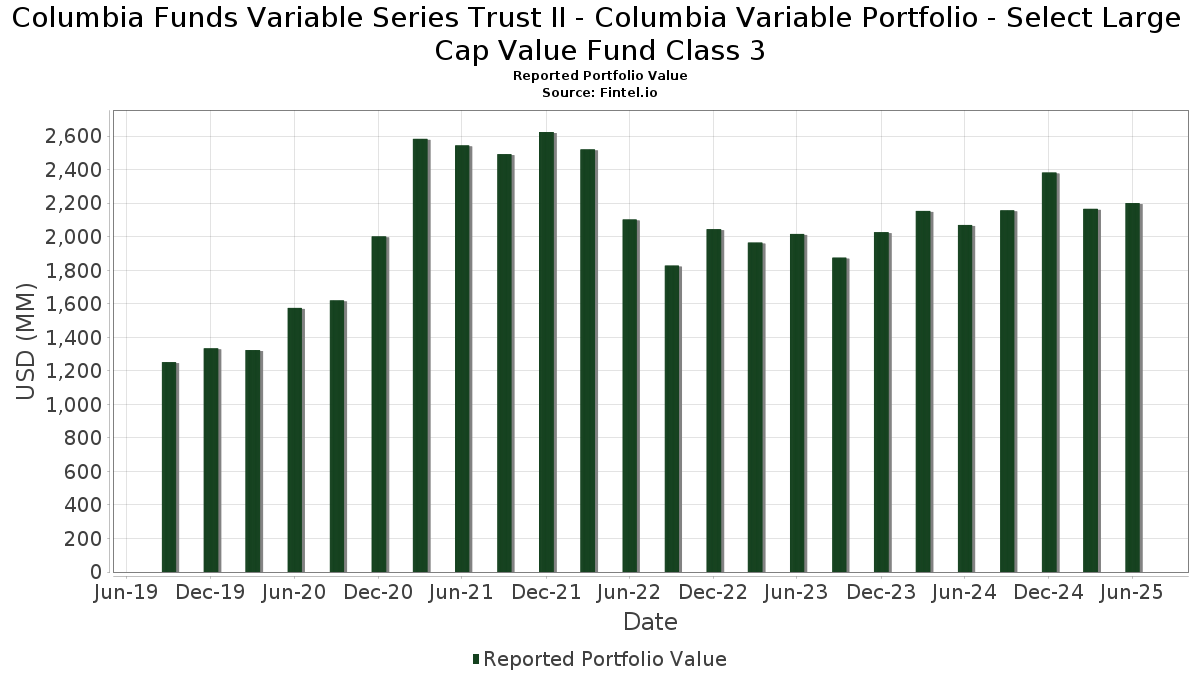
| Portfolio Value | $ 2,200,833,433 |
| Current Positions | 38 |
Latest Holdings, Performance, AUM (from 13F, 13D)
Columbia Funds Variable Series Trust II - Columbia Variable Portfolio - Select Large Cap Value Fund Class 3 has disclosed 38 total holdings in their latest SEC filings. Most recent portfolio value is calculated to be $ 2,200,833,433 USD. Actual Assets Under Management (AUM) is this value plus cash (which is not disclosed). Columbia Funds Variable Series Trust II - Columbia Variable Portfolio - Select Large Cap Value Fund Class 3’s top holdings are Applied Materials, Inc. (US:AMAT) , Verizon Communications Inc. (US:VZ) , Corning Incorporated (US:GLW) , TechnipFMC plc (US:FTI) , and Citigroup Inc. (US:C) . Columbia Funds Variable Series Trust II - Columbia Variable Portfolio - Select Large Cap Value Fund Class 3’s new positions include Constellation Brands, Inc. (US:STZ) , .
Top Increases This Quarter
We use the change in the portfolio allocation because this is the most meaningful metric. Changes can be due to trades or changes in share prices.
| Security | Shares (MM) |
Value (MM$) |
Portfolio % | ΔPortfolio % |
|---|---|---|---|---|
| 0.31 | 49.67 | 2.2558 | 2.2558 | |
| 0.46 | 83.93 | 3.8113 | 0.9104 | |
| 1.50 | 78.91 | 3.5837 | 0.7861 | |
| 0.16 | 62.47 | 2.8371 | 0.7370 | |
| 0.36 | 63.38 | 2.8783 | 0.6577 | |
| 6.91 | 72.71 | 3.3020 | 0.3874 | |
| 0.86 | 73.57 | 3.3409 | 0.3444 | |
| 0.43 | 60.92 | 2.7665 | 0.3022 | |
| 0.24 | 70.23 | 3.1893 | 0.2872 | |
| 0.45 | 65.79 | 2.9877 | 0.2141 |
Top Decreases This Quarter
We use the change in the portfolio allocation because this is the most meaningful metric. Changes can be due to trades or changes in share prices.
| Security | Shares (MM) |
Value (MM$) |
Portfolio % | ΔPortfolio % |
|---|---|---|---|---|
| 1.02 | 47.36 | 2.1508 | -0.8968 | |
| 1.17 | 38.25 | 1.7372 | -0.6655 | |
| 0.34 | 48.20 | 2.1887 | -0.5613 | |
| 0.14 | 47.21 | 2.1441 | -0.5133 | |
| 1.83 | 79.11 | 3.5925 | -0.4576 | |
| 0.89 | 48.26 | 2.1917 | -0.4446 | |
| 0.29 | 64.84 | 2.9446 | -0.3843 | |
| 1.08 | 35.19 | 1.5981 | -0.3691 | |
| 0.96 | 65.98 | 2.9963 | -0.3628 | |
| 0.35 | 63.01 | 2.8613 | -0.3461 |
13F and Fund Filings
This form was filed on 2025-08-22 for the reporting period 2025-06-30. Click the link icon to see the full transaction history.
Upgrade to unlock premium data and export to Excel ![]() .
.
| Security | Type | Avg Share Price | Shares (MM) |
ΔShares (%) |
ΔShares (%) |
Value ($MM) |
Portfolio (%) |
ΔPortfolio (%) |
|
|---|---|---|---|---|---|---|---|---|---|
| AMAT / Applied Materials, Inc. | 0.46 | 5.83 | 83.93 | 33.50 | 3.8113 | 0.9104 | |||
| VZ / Verizon Communications Inc. | 1.83 | -5.52 | 79.11 | -9.87 | 3.5925 | -0.4576 | |||
| GLW / Corning Incorporated | 1.50 | 13.31 | 78.91 | 30.16 | 3.5837 | 0.7861 | |||
| FTI / TechnipFMC plc | 2.18 | -7.21 | 75.25 | 0.84 | 3.4172 | -0.0260 | |||
| C / Citigroup Inc. | 0.86 | -5.52 | 73.57 | 13.29 | 3.3409 | 0.3444 | |||
| BA / The Boeing Company | 0.35 | -20.72 | 73.35 | -2.60 | 3.3311 | -0.1441 | |||
| FCX / Freeport-McMoRan Inc. | 1.69 | -13.10 | 73.14 | -0.50 | 3.3217 | -0.0703 | |||
| AES / The AES Corporation | 6.91 | 35.91 | 72.71 | 15.11 | 3.3020 | 0.3874 | |||
| JPM / JPMorgan Chase & Co. | 0.24 | -5.52 | 70.23 | 11.66 | 3.1893 | 0.2872 | |||
| EPAM / EPAM Systems, Inc. | 0.38 | 3.58 | 66.78 | 8.48 | 3.0325 | 0.1920 | |||
| AMT / American Tower Corporation | 0.30 | -5.52 | 66.59 | -4.03 | 3.0242 | -0.1778 | |||
| CVS / CVS Health Corporation | 0.96 | -10.98 | 65.98 | -9.36 | 2.9963 | -0.3628 | |||
| RTX / RTX Corporation | 0.45 | -0.71 | 65.79 | 9.45 | 2.9877 | 0.2141 | |||
| AIG / American International Group, Inc. | 0.76 | -5.52 | 65.18 | -6.99 | 2.9601 | -0.2735 | |||
| LOW / Lowe's Companies, Inc. | 0.29 | -5.52 | 64.84 | -10.12 | 2.9446 | -0.3843 | |||
| PCG / PG&E Corporation | 4.61 | 13.96 | 64.27 | -7.53 | 2.9185 | -0.2886 | |||
| THC / Tenet Healthcare Corporation | 0.36 | 0.65 | 63.38 | 31.70 | 2.8783 | 0.6577 | |||
| PM / Philip Morris International Inc. | 0.35 | -21.00 | 63.01 | -9.36 | 2.8613 | -0.3461 | |||
| CAT / Caterpillar Inc. | 0.16 | 16.62 | 62.47 | 37.27 | 2.8371 | 0.7370 | |||
| BAC / Bank of America Corporation | 1.31 | -5.52 | 62.00 | 7.14 | 2.8156 | 0.1453 | |||
| MS / Morgan Stanley | 0.43 | -5.52 | 60.92 | 14.07 | 2.7665 | 0.3022 | |||
| QCOM / QUALCOMM Incorporated | 0.37 | -5.52 | 58.60 | -2.04 | 2.6614 | -0.0992 | |||
| WMB / The Williams Companies, Inc. | 0.86 | -15.01 | 53.88 | -10.68 | 2.4468 | -0.3366 | |||
| MET / MetLife, Inc. | 0.66 | -5.52 | 53.14 | -5.36 | 2.4131 | -0.1779 | |||
| MPC / Marathon Petroleum Corporation | 0.30 | -5.52 | 50.18 | 7.72 | 2.2787 | 0.1294 | |||
| WFC / Wells Fargo & Company | 0.63 | -5.52 | 50.13 | 5.45 | 2.2764 | 0.0828 | |||
| STZ / Constellation Brands, Inc. | 0.31 | 49.67 | 2.2558 | 2.2558 | |||||
| CNC / Centene Corporation | 0.89 | -5.52 | 48.26 | -15.52 | 2.1917 | -0.4446 | |||
| CVX / Chevron Corporation | 0.34 | -5.52 | 48.20 | -19.13 | 2.1887 | -0.5613 | |||
| BMY / Bristol-Myers Squibb Company | 1.02 | -5.52 | 47.36 | -28.29 | 2.1508 | -0.8968 | |||
| CI / The Cigna Group | 0.14 | -18.41 | 47.21 | -18.02 | 2.1441 | -0.5133 | |||
| B / Barrick Mining Corporation | 2.08 | -5.52 | 43.33 | 1.19 | 1.9678 | -0.0082 | |||
| GOOGL / Alphabet Inc. | 0.24 | -5.52 | 43.08 | 7.67 | 1.9565 | 0.1102 | |||
| 19766H239 / COLUMBIA SHORT TERM CASH FUND | 42.26 | 7.70 | 42.25 | 7.70 | 1.9186 | 0.1086 | |||
| CSX / CSX Corporation | 1.17 | -33.74 | 38.25 | -26.54 | 1.7372 | -0.6655 | |||
| LUV / Southwest Airlines Co. | 1.08 | -14.55 | 35.19 | -17.45 | 1.5981 | -0.3691 | |||
| TDC / Teradata Corporation | 0.93 | -16.58 | 20.75 | -17.21 | 0.9422 | -0.2142 | |||
| FE / FirstEnergy Corp. | 0.50 | -5.52 | 19.95 | -5.89 | 0.9060 | -0.0722 |