Basic Stats
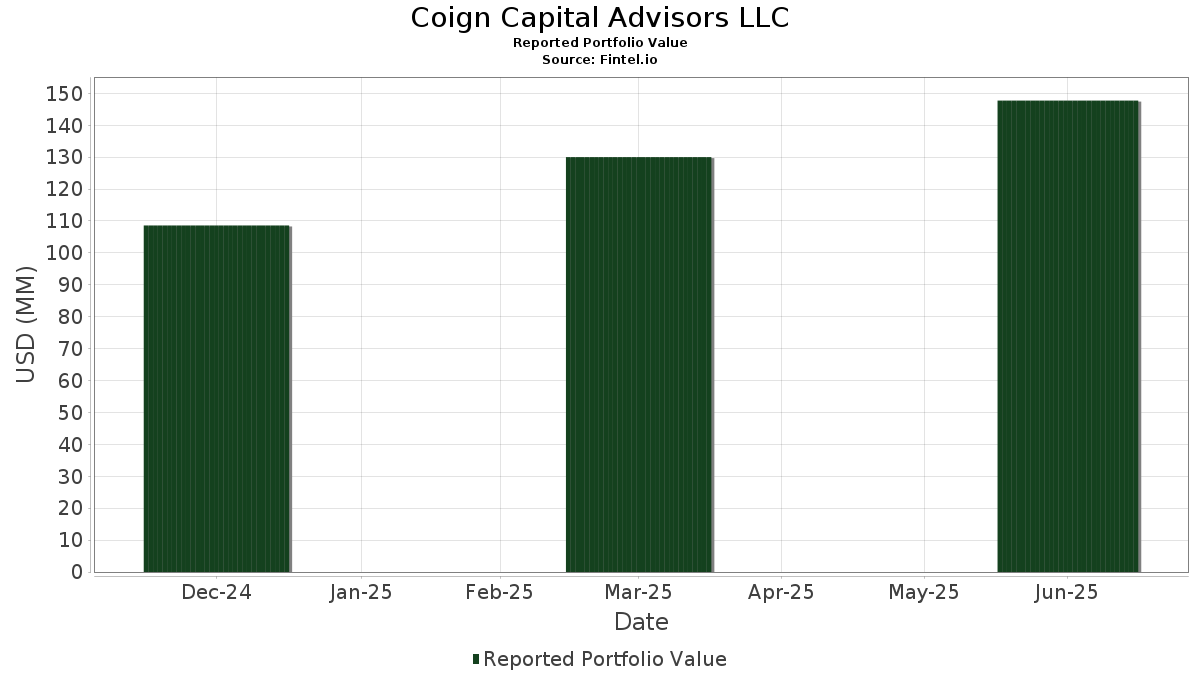
| Portfolio Value | $ 147,723,235 |
| Current Positions | 78 |
Latest Holdings, Performance, AUM (from 13F, 13D)
Coign Capital Advisors LLC has disclosed 78 total holdings in their latest SEC filings. Most recent portfolio value is calculated to be $ 147,723,235 USD. Actual Assets Under Management (AUM) is this value plus cash (which is not disclosed). Coign Capital Advisors LLC’s top holdings are John Hancock Exchange-Traded Fund Trust - John Hancock Core Plus Bond ETF (US:JHCP) , Vanguard Admiral Funds - Vanguard S&P Mid-Cap 400 ETF (US:IVOO) , Morgan Stanley ETF Trust - Eaton Vance Total Return Bond ETF (US:EVTR) , Capital Group Growth ETF (US:CGGR) , and iShares Trust - iShares Core S&P 500 ETF (US:IVV) . Coign Capital Advisors LLC’s new positions include Capital Group Growth ETF (US:CGGR) , HIVE Digital Technologies Ltd. (US:HIVE) , .
Top Increases This Quarter
We use the change in the portfolio allocation because this is the most meaningful metric. Changes can be due to trades or changes in share prices.
| Security | Shares (MM) |
Value (MM$) |
Portfolio % | ΔPortfolio % |
|---|---|---|---|---|
| 0.23 | 9.29 | 6.2902 | 6.2902 | |
| 0.04 | 1.85 | 1.2552 | 0.5059 | |
| 0.18 | 7.43 | 5.0279 | 0.4929 | |
| 0.00 | 1.48 | 1.0008 | 0.2089 | |
| 0.00 | 1.80 | 1.2169 | 0.2022 | |
| 0.00 | 0.90 | 0.6120 | 0.1963 | |
| 0.03 | 2.80 | 1.8932 | 0.1855 | |
| 0.01 | 1.04 | 0.7060 | 0.1790 | |
| 0.00 | 1.56 | 1.0582 | 0.1636 | |
| 0.03 | 2.04 | 1.3834 | 0.1590 |
Top Decreases This Quarter
We use the change in the portfolio allocation because this is the most meaningful metric. Changes can be due to trades or changes in share prices.
| Security | Shares (MM) |
Value (MM$) |
Portfolio % | ΔPortfolio % |
|---|---|---|---|---|
| 0.16 | 7.87 | 5.3274 | -1.5034 | |
| 0.05 | 2.18 | 1.4781 | -1.0357 | |
| 0.27 | 6.13 | 4.1488 | -0.9813 | |
| 0.01 | 3.78 | 2.5557 | -0.7740 | |
| 0.01 | 7.88 | 5.3346 | -0.6005 | |
| 0.10 | 10.79 | 7.3015 | -0.5910 | |
| 0.45 | 11.22 | 7.5967 | -0.3792 | |
| 0.21 | 10.64 | 7.2043 | -0.2827 | |
| 0.05 | 4.75 | 3.2157 | -0.2267 | |
| 0.01 | 1.48 | 1.0038 | -0.2155 |
13F and Fund Filings
This form was filed on 2025-08-04 for the reporting period 2025-06-30. Click the link icon to see the full transaction history.
Upgrade to unlock premium data and export to Excel ![]() .
.
| Security | Type | Avg Share Price | Shares (MM) |
ΔShares (%) |
ΔShares (%) |
Value ($MM) |
Portfolio (%) |
ΔPortfolio (%) |
|
|---|---|---|---|---|---|---|---|---|---|
| JHCP / John Hancock Exchange-Traded Fund Trust - John Hancock Core Plus Bond ETF | 0.45 | 8.23 | 11.22 | 8.23 | 7.5967 | -0.3792 | |||
| IVOO / Vanguard Admiral Funds - Vanguard S&P Mid-Cap 400 ETF | 0.10 | -1.17 | 10.79 | 5.12 | 7.3015 | -0.5910 | |||
| EVTR / Morgan Stanley ETF Trust - Eaton Vance Total Return Bond ETF | 0.21 | 8.83 | 10.64 | 9.34 | 7.2043 | -0.2827 | |||
| CGGR / Capital Group Growth ETF | 0.23 | 9.29 | 6.2902 | 6.2902 | |||||
| IVV / iShares Trust - iShares Core S&P 500 ETF | 0.01 | -7.57 | 7.88 | 2.14 | 5.3346 | -0.6005 | |||
| TBIL / The RBB Fund, Inc. - F/m US Treasury 3 Month Bill ETF | 0.16 | -11.36 | 7.87 | -11.39 | 5.3274 | -1.5034 | |||
| PVAL / Putnam ETF Trust - Putnam Focused Large Cap Value ETF | 0.18 | 19.24 | 7.43 | 25.99 | 5.0279 | 0.4929 | |||
| GOVT / iShares Trust - iShares U.S. Treasury Bond ETF | 0.27 | -8.09 | 6.13 | -8.11 | 4.1488 | -0.9813 | |||
| IJH / iShares Trust - iShares Core S&P Mid-Cap ETF | 0.09 | 11.31 | 5.48 | 18.31 | 3.7099 | 0.1469 | |||
| IJR / iShares Trust - iShares Core S&P Small-Cap ETF | 0.05 | 12.25 | 5.22 | 17.32 | 3.5318 | 0.1112 | |||
| AGG / iShares Trust - iShares Core U.S. Aggregate Bond ETF | 0.05 | 5.85 | 4.75 | 6.15 | 3.2157 | -0.2267 | |||
| SPY / SPDR S&P 500 ETF | 0.01 | -21.03 | 3.78 | -12.78 | 2.5557 | -0.7740 | |||
| IVW / iShares Trust - iShares S&P 500 Growth ETF | 0.03 | 6.21 | 2.80 | 25.95 | 1.8932 | 0.1855 | |||
| IVE / iShares Trust - iShares S&P 500 Value ETF | 0.01 | 9.94 | 2.64 | 12.71 | 1.7889 | -0.0142 | |||
| PTRB / PGIM ETF Trust - PGIM Total Return Bond ETF | 0.05 | -33.33 | 2.18 | -33.20 | 1.4781 | -1.0357 | |||
| PJIO / PGIM ETF Trust - PGIM Jennison International Opportunities ETF | 0.03 | 10.49 | 2.04 | 28.41 | 1.3834 | 0.1590 | |||
| EVIM / Morgan Stanley ETF Trust - Eaton Vance Intermediate Municipal Income ETF | 0.04 | 91.15 | 1.85 | 90.35 | 1.2552 | 0.5059 | |||
| MSFT / Microsoft Corporation | 0.00 | 2.85 | 1.80 | 36.24 | 1.2169 | 0.2022 | |||
| META / Meta Platforms, Inc. | 0.00 | 4.96 | 1.56 | 34.39 | 1.0582 | 0.1636 | |||
| NVDA / NVIDIA Corporation | 0.01 | -12.10 | 1.54 | 28.13 | 1.0454 | 0.1184 | |||
| HYG / iShares Trust - iShares iBoxx $ High Yield Corporate Bond ETF | 0.02 | 5.26 | 1.54 | 7.61 | 1.0441 | -0.0584 | |||
| AAPL / Apple Inc. | 0.01 | 1.28 | 1.48 | -6.50 | 1.0038 | -0.2155 | |||
| NFLX / Netflix, Inc. | 0.00 | 0.00 | 1.48 | 43.63 | 1.0008 | 0.2089 | |||
| GOOG / Alphabet Inc. | 0.01 | 1.60 | 1.42 | 15.34 | 0.9625 | 0.0144 | |||
| IEFA / iShares Trust - iShares Core MSCI EAFE ETF | 0.02 | 2.03 | 1.39 | 12.60 | 0.9378 | -0.0087 | |||
| AMZN / Amazon.com, Inc. | 0.01 | 0.07 | 1.35 | 15.38 | 0.9144 | 0.0139 | |||
| PEP / PepsiCo, Inc. | 0.01 | 2.37 | 1.15 | -9.84 | 0.7813 | -0.2035 | |||
| FSK / FS KKR Capital Corp. | 0.05 | -4.20 | 1.05 | -5.05 | 0.7125 | -0.1404 | |||
| APH / Amphenol Corporation | 0.01 | 1.11 | 1.04 | 52.12 | 0.7060 | 0.1790 | |||
| V / Visa Inc. | 0.00 | 1.15 | 1.03 | 2.50 | 0.6951 | -0.0756 | |||
| RTX / RTX Corporation | 0.01 | 1.16 | 0.98 | 11.63 | 0.6628 | -0.0125 | |||
| AVGO / Broadcom Inc. | 0.00 | 1.61 | 0.90 | 67.41 | 0.6120 | 0.1963 | |||
| EEM / iShares, Inc. - iShares MSCI Emerging Markets ETF | 0.02 | 2.71 | 0.86 | 13.39 | 0.5854 | -0.0012 | |||
| JPM / JPMorgan Chase & Co. | 0.00 | 1.24 | 0.83 | 19.68 | 0.5601 | 0.0282 | |||
| UBER / Uber Technologies, Inc. | 0.01 | 1.74 | 0.75 | 30.38 | 0.5087 | 0.0651 | |||
| AMD / Advanced Micro Devices, Inc. | 0.01 | 2.06 | 0.74 | 41.03 | 0.5008 | 0.0971 | |||
| TSLA / Tesla, Inc. | 0.00 | 4.94 | 0.73 | 28.80 | 0.4935 | 0.0575 | |||
| MA / Mastercard Incorporated | 0.00 | 1.17 | 0.73 | 3.70 | 0.4934 | -0.0471 | |||
| WMT / Walmart Inc. | 0.01 | 1.30 | 0.71 | 12.88 | 0.4808 | -0.0035 | |||
| BAC / Bank of America Corporation | 0.01 | 2.10 | 0.70 | 15.87 | 0.4747 | 0.0088 | |||
| SPEM / SPDR Index Shares Funds - SPDR Portfolio Emerging Markets ETF | 0.02 | -0.88 | 0.70 | 7.53 | 0.4745 | -0.0265 | |||
| AXP / American Express Company | 0.00 | 1.76 | 0.70 | 20.55 | 0.4731 | 0.0275 | |||
| MS / Morgan Stanley | 0.00 | 2.00 | 0.70 | 23.14 | 0.4719 | 0.0365 | |||
| ISRG / Intuitive Surgical, Inc. | 0.00 | 1.61 | 0.69 | 11.54 | 0.4646 | -0.0089 | |||
| MCK / McKesson Corporation | 0.00 | 1.19 | 0.69 | 10.13 | 0.4643 | -0.0145 | |||
| BRK.B / Berkshire Hathaway Inc. | 0.00 | 17.92 | 0.67 | 7.58 | 0.4522 | -0.0255 | |||
| CB / Chubb Limited | 0.00 | 1.38 | 0.66 | -2.66 | 0.4457 | -0.0750 | |||
| CI / The Cigna Group | 0.00 | 1.49 | 0.65 | 2.03 | 0.4431 | -0.0506 | |||
| PGR / The Progressive Corporation | 0.00 | 1.59 | 0.65 | -4.14 | 0.4388 | -0.0817 | |||
| NOC / Northrop Grumman Corporation | 0.00 | 1.33 | 0.65 | -1.07 | 0.4380 | -0.0650 | |||
| ORLY / O'Reilly Automotive, Inc. | 0.01 | 1,414.16 | 0.64 | -4.80 | 0.4305 | -0.0830 | |||
| XOM / Exxon Mobil Corporation | 0.01 | 2.21 | 0.62 | -7.35 | 0.4188 | -0.0949 | |||
| QCOM / QUALCOMM Incorporated | 0.00 | 2.22 | 0.62 | 6.02 | 0.4172 | -0.0301 | |||
| LLY / Eli Lilly and Company | 0.00 | 2.33 | 0.62 | -3.30 | 0.4164 | -0.0734 | |||
| JNJ / Johnson & Johnson | 0.00 | 1.93 | 0.61 | -6.12 | 0.4161 | -0.0875 | |||
| CRM / Salesforce, Inc. | 0.00 | 2.20 | 0.61 | 3.93 | 0.4119 | -0.0388 | |||
| MMC / Marsh & McLennan Companies, Inc. | 0.00 | 2.03 | 0.61 | -8.61 | 0.4098 | -0.0996 | |||
| HON / Honeywell International Inc. | 0.00 | 2.24 | 0.59 | 12.50 | 0.4022 | -0.0042 | |||
| ADBE / Adobe Inc. | 0.00 | 2.13 | 0.59 | 3.14 | 0.4010 | -0.0413 | |||
| ABT / Abbott Laboratories | 0.00 | 2.74 | 0.58 | 5.25 | 0.3937 | -0.0310 | |||
| CMCSA / Comcast Corporation | 0.02 | 2.08 | 0.57 | -1.22 | 0.3846 | -0.0580 | |||
| ADI / Analog Devices, Inc. | 0.00 | 4.62 | 0.57 | 23.58 | 0.3835 | 0.0306 | |||
| CVX / Chevron Corporation | 0.00 | 2.54 | 0.56 | -12.21 | 0.3801 | -0.1120 | |||
| VTI / Vanguard Index Funds - Vanguard Total Stock Market ETF | 0.00 | 0.00 | 0.54 | 10.45 | 0.3655 | -0.0101 | |||
| JEPI / J.P. Morgan Exchange-Traded Fund Trust - JPMorgan Equity Premium Income ETF | 0.01 | -5.14 | 0.53 | -5.72 | 0.3573 | -0.0729 | |||
| COP / ConocoPhillips | 0.01 | 2.61 | 0.52 | -12.37 | 0.3552 | -0.1051 | |||
| UPS / United Parcel Service, Inc. | 0.00 | 2.69 | 0.50 | -5.79 | 0.3416 | -0.0703 | |||
| TMO / Thermo Fisher Scientific Inc. | 0.00 | 2.99 | 0.50 | -16.05 | 0.3399 | -0.1203 | |||
| BDX / Becton, Dickinson and Company | 0.00 | 3.06 | 0.46 | -22.58 | 0.3139 | -0.1463 | |||
| UNH / UnitedHealth Group Incorporated | 0.00 | 10.55 | 0.42 | -34.17 | 0.2832 | -0.2055 | |||
| REGN / Regeneron Pharmaceuticals, Inc. | 0.00 | 3.74 | 0.41 | -14.32 | 0.2761 | -0.0893 | |||
| AMP / Ameriprise Financial, Inc. | 0.00 | 0.00 | 0.33 | 10.30 | 0.2251 | -0.0069 | |||
| GOOGL / Alphabet Inc. | 0.00 | 9.74 | 0.31 | 24.80 | 0.2084 | 0.0191 | |||
| ADP / Automatic Data Processing, Inc. | 0.00 | 0.23 | 0.27 | 1.12 | 0.1846 | -0.0227 | |||
| CAH / Cardinal Health, Inc. | 0.00 | 0.00 | 0.24 | 22.00 | 0.1655 | 0.0113 | |||
| QQQ / Invesco QQQ Trust, Series 1 | 0.00 | 0.21 | 0.1389 | 0.1389 | |||||
| MPW / Medical Properties Trust, Inc. | 0.04 | 5.11 | 0.16 | -24.88 | 0.1064 | -0.0545 | |||
| HIVE / HIVE Digital Technologies Ltd. | 0.01 | 0.02 | 0.0122 | 0.0122 | |||||
| MCHP / Microchip Technology Incorporated | 0.00 | -100.00 | 0.00 | 0.0000 |