Basic Stats
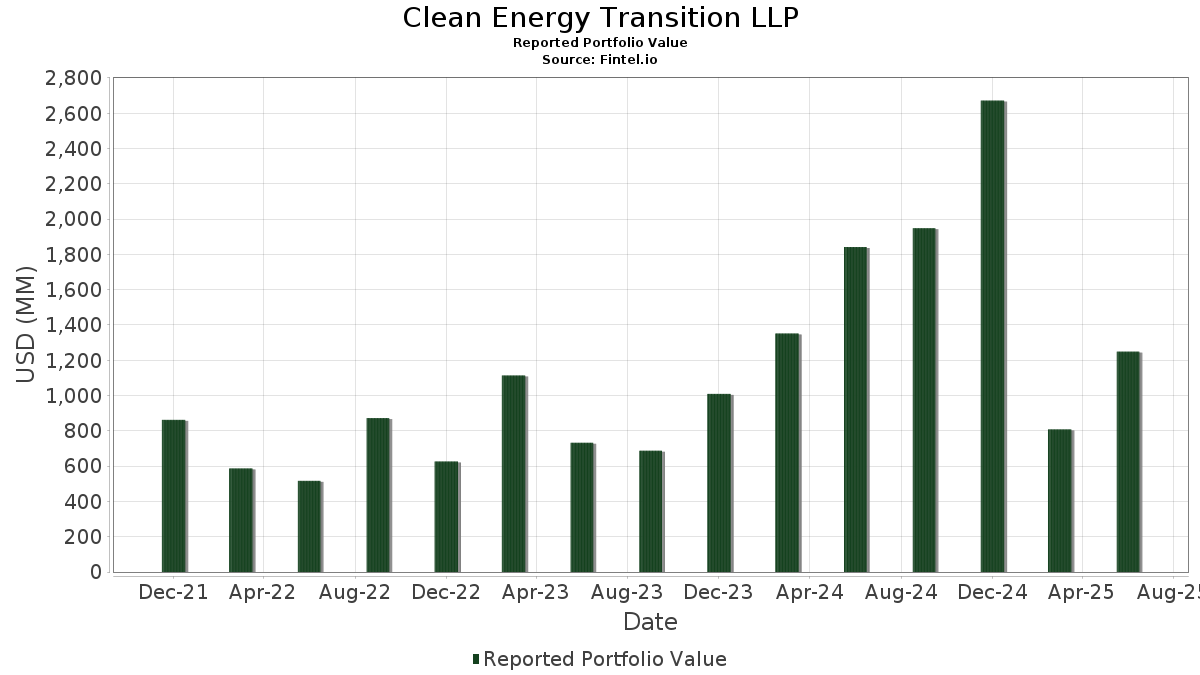
| Portfolio Value | $ 1,248,900,017 |
| Current Positions | 17 |
Latest Holdings, Performance, AUM (from 13F, 13D)
Clean Energy Transition LLP has disclosed 17 total holdings in their latest SEC filings. Most recent portfolio value is calculated to be $ 1,248,900,017 USD. Actual Assets Under Management (AUM) is this value plus cash (which is not disclosed). Clean Energy Transition LLP’s top holdings are Tesla, Inc. (US:TSLA) , Emerson Electric Co. (US:EMR) , nVent Electric plc (US:NVT) , First Solar, Inc. (US:FSLR) , and Stanley Black & Decker, Inc. (US:SWK) . Clean Energy Transition LLP’s new positions include Knight-Swift Transportation Holdings Inc. (US:KNX) , Ralliant Corporation (US:RAL) , Pentair plc (US:PNR) , .
Top Increases This Quarter
We use the change in the portfolio allocation because this is the most meaningful metric. Changes can be due to trades or changes in share prices.
| Security | Shares (MM) |
Value (MM$) |
Portfolio % | ΔPortfolio % |
|---|---|---|---|---|
| 0.71 | 227.13 | 18.1862 | 18.1862 | |
| 0.57 | 56.75 | 4.5443 | 4.5443 | |
| 1.17 | 51.82 | 4.1490 | 4.1490 | |
| 1.24 | 165.36 | 13.2403 | 4.1465 | |
| 0.33 | 32.58 | 2.6086 | 2.6086 | |
| 0.53 | 25.67 | 2.0558 | 2.0558 | |
| 0.25 | 25.35 | 2.0301 | 2.0301 | |
| 0.32 | 35.69 | 2.8581 | 0.7588 |
Top Decreases This Quarter
We use the change in the portfolio allocation because this is the most meaningful metric. Changes can be due to trades or changes in share prices.
| Security | Shares (MM) |
Value (MM$) |
Portfolio % | ΔPortfolio % |
|---|---|---|---|---|
| 0.00 | 0.00 | -11.5499 | ||
| 0.44 | 27.72 | 2.2193 | -5.3044 | |
| 1.79 | 120.97 | 9.6857 | -3.3795 | |
| 1.95 | 142.98 | 11.4482 | -3.2111 | |
| 0.09 | 31.83 | 2.5490 | -2.6701 | |
| 0.03 | 16.89 | 1.3526 | -1.9366 | |
| 0.75 | 124.81 | 9.9936 | -1.5428 | |
| 1.13 | 58.96 | 4.7209 | -1.2383 | |
| 0.23 | 42.10 | 3.3711 | -0.6254 | |
| 1.07 | 62.29 | 4.9872 | -0.1624 |
13F and Fund Filings
This form was filed on 2025-08-11 for the reporting period 2025-06-30. Click the link icon to see the full transaction history.
Upgrade to unlock premium data and export to Excel ![]() .
.
| Security | Type | Avg Share Price | Shares (MM) |
ΔShares (%) |
ΔShares (%) |
Value ($MM) |
Portfolio (%) |
ΔPortfolio (%) |
|
|---|---|---|---|---|---|---|---|---|---|
| TSLA / Tesla, Inc. | Put | 0.71 | 227.13 | 18.1862 | 18.1862 | ||||
| EMR / Emerson Electric Co. | 1.24 | 85.02 | 165.36 | 125.00 | 13.2403 | 4.1465 | |||
| NVT / nVent Electric plc | 1.95 | -13.64 | 142.98 | 20.68 | 11.4482 | -3.2111 | |||
| FSLR / First Solar, Inc. | 0.75 | 2.24 | 124.81 | 33.87 | 9.9936 | -1.5428 | |||
| SWK / Stanley Black & Decker, Inc. | 1.79 | 30.00 | 120.97 | 14.56 | 9.6857 | -3.3795 | |||
| EQT / EQT Corporation | 1.07 | 37.11 | 62.29 | 49.66 | 4.9872 | -0.1624 | |||
| FTV / Fortive Corporation | 1.13 | 71.86 | 58.96 | 22.42 | 4.7209 | -1.2383 | |||
| ED / Consolidated Edison, Inc. | 0.57 | 56.75 | 4.5443 | 4.5443 | |||||
| KNX / Knight-Swift Transportation Holdings Inc. | 1.17 | 51.82 | 4.1490 | 4.1490 | |||||
| WCC / WESCO International, Inc. | 0.23 | 9.31 | 42.10 | 30.35 | 3.3711 | -0.6254 | |||
| DTM / DT Midstream, Inc. | 0.32 | 84.68 | 35.69 | 110.39 | 2.8581 | 0.7588 | |||
| OTIS / Otis Worldwide Corporation | 0.33 | 32.58 | 2.6086 | 2.6086 | |||||
| ETN / Eaton Corporation plc | 0.09 | -42.53 | 31.83 | -24.53 | 2.5490 | -2.6701 | |||
| WMB / The Williams Companies, Inc. | 0.44 | -56.63 | 27.72 | -54.42 | 2.2193 | -5.3044 | |||
| RAL / Ralliant Corporation | 0.53 | 25.67 | 2.0558 | 2.0558 | |||||
| PNR / Pentair plc | 0.25 | 25.35 | 2.0301 | 2.0301 | |||||
| GEV / GE Vernova Inc. | 0.03 | -63.34 | 16.89 | -36.45 | 1.3526 | -1.9366 | |||
| FSLR / First Solar, Inc. | Call | 0.00 | -100.00 | 0.00 | -100.00 | -11.5499 | |||
| WY / Weyerhaeuser Company | 0.00 | -100.00 | 0.00 | 0.0000 |