Basic Stats
| Portfolio Value | $ 928,403,067 |
| Current Positions | 71 |
Latest Holdings, Performance, AUM (from 13F, 13D)
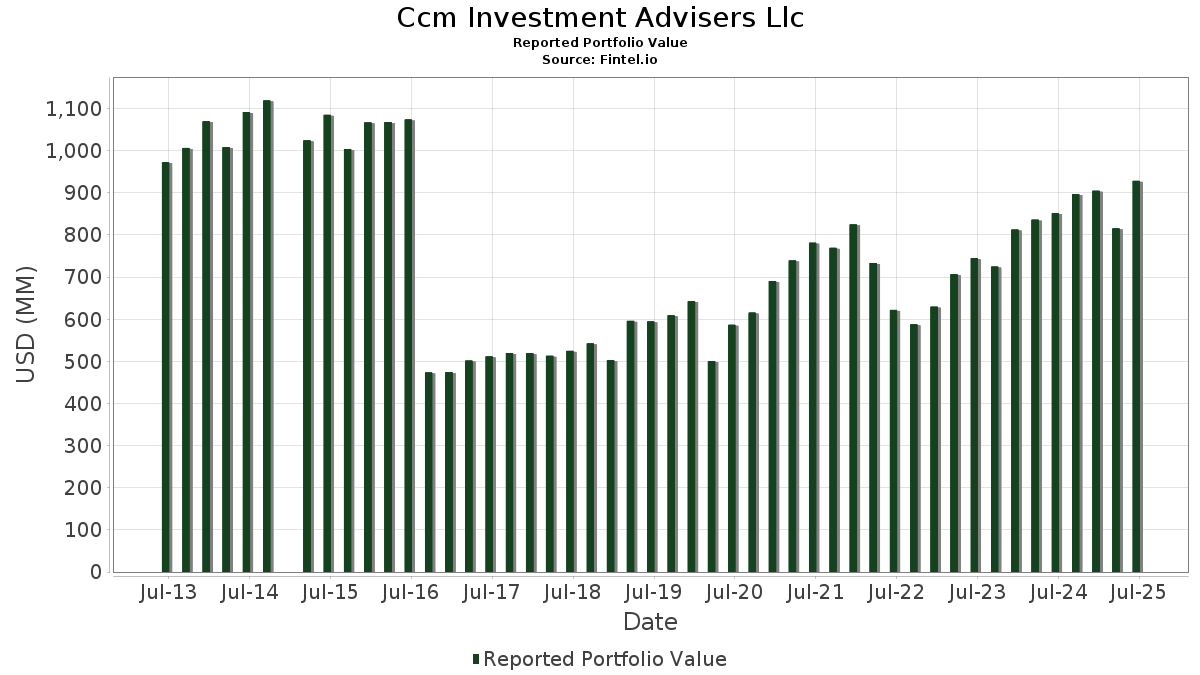
Ccm Investment Advisers Llc has disclosed 71 total holdings in their latest SEC filings. Most recent portfolio value is calculated to be $ 928,403,067 USD. Actual Assets Under Management (AUM) is this value plus cash (which is not disclosed). Ccm Investment Advisers Llc’s top holdings are Direxion Shares ETF Trust - Direxion Daily NVDA Bear 1X Shares (US:NVDD) , Microsoft Corporation (US:MSFT) , Broadcom Inc. (US:AVGO) , Amazon.com, Inc. (US:AMZN) , and Jabil Inc. (US:JBL) . Ccm Investment Advisers Llc’s new positions include Charles Schwab Family Of Funds - Schwab Government Securities Fund (US:SWGXX) , .
Top Increases This Quarter
We use the change in the portfolio allocation because this is the most meaningful metric. Changes can be due to trades or changes in share prices.
| Security | Shares (MM) |
Value (MM$) |
Portfolio % | ΔPortfolio % |
|---|---|---|---|---|
| 0.12 | 32.38 | 3.4880 | 0.9920 | |
| 0.02 | 8.22 | 0.8854 | 0.8854 | |
| 0.09 | 8.07 | 0.8694 | 0.8694 | |
| 0.14 | 30.10 | 3.2419 | 0.8638 | |
| 0.25 | 39.29 | 4.2320 | 0.8517 | |
| 0.15 | 22.27 | 2.3993 | 0.7674 | |
| 0.02 | 27.52 | 2.9637 | 0.5555 | |
| 0.07 | 34.22 | 3.6856 | 0.4224 | |
| 0.04 | 19.62 | 2.1134 | 0.4047 | |
| 0.06 | 22.53 | 2.4266 | 0.3501 |
Top Decreases This Quarter
We use the change in the portfolio allocation because this is the most meaningful metric. Changes can be due to trades or changes in share prices.
| Security | Shares (MM) |
Value (MM$) |
Portfolio % | ΔPortfolio % |
|---|---|---|---|---|
| 0.01 | 2.63 | 0.2828 | -1.7259 | |
| 0.01 | 7.93 | 0.8546 | -0.6501 | |
| 0.13 | 25.87 | 2.7866 | -0.6234 | |
| 0.07 | 12.25 | 1.3196 | -0.5184 | |
| 0.03 | 12.71 | 1.3689 | -0.5166 | |
| 0.03 | 15.68 | 1.6894 | -0.3932 | |
| 0.08 | 15.11 | 1.6279 | -0.3641 | |
| 0.07 | 10.42 | 1.1222 | -0.3624 | |
| 0.05 | 13.96 | 1.5032 | -0.2692 | |
| 0.07 | 17.80 | 1.9168 | -0.2201 |
13F and Fund Filings
This form was filed on 2025-07-15 for the reporting period 2025-06-30. Click the link icon to see the full transaction history.
Upgrade to unlock premium data and export to Excel ![]() .
.
| Security | Type | Avg Share Price | Shares (MM) |
ΔShares (%) |
ΔShares (%) |
Value ($MM) |
Portfolio (%) |
ΔPortfolio (%) |
|
|---|---|---|---|---|---|---|---|---|---|
| NVDD / Direxion Shares ETF Trust - Direxion Daily NVDA Bear 1X Shares | 0.25 | -2.21 | 39.29 | 42.55 | 4.2320 | 0.8517 | |||
| MSFT / Microsoft Corporation | 0.07 | -2.94 | 34.22 | 28.60 | 3.6856 | 0.4224 | |||
| AVGO / Broadcom Inc. | 0.12 | -3.35 | 32.38 | 59.12 | 3.4880 | 0.9920 | |||
| AMZN / Amazon.com, Inc. | 0.14 | 1.23 | 31.11 | 16.73 | 3.3505 | 0.0824 | |||
| JBL / Jabil Inc. | 0.14 | -3.16 | 30.10 | 55.23 | 3.2419 | 0.8638 | |||
| META / Meta Platforms, Inc. | 0.04 | -0.45 | 27.78 | 27.49 | 2.9927 | 0.3198 | |||
| NFLX / Netflix, Inc. | 0.02 | -2.42 | 27.52 | 40.13 | 2.9637 | 0.5555 | |||
| GOOGL / Alphabet Inc. | 0.15 | 0.71 | 26.62 | 14.77 | 2.8668 | 0.0226 | |||
| AAPL / Apple Inc. | 0.13 | 0.74 | 25.87 | -6.95 | 2.7866 | -0.6234 | |||
| BKNG / Booking Holdings Inc. | 0.00 | -2.67 | 24.31 | 22.31 | 2.6187 | 0.1809 | |||
| ETN / Eaton Corporation plc | 0.06 | 1.32 | 22.53 | 33.06 | 2.4266 | 0.3501 | |||
| STX / Seagate Technology Holdings plc | 0.15 | -1.47 | 22.27 | 67.40 | 2.3993 | 0.7674 | |||
| CSCO / Cisco Systems, Inc. | 0.32 | 0.72 | 22.24 | 13.24 | 2.3953 | -0.0132 | |||
| JPM / JPMorgan Chase & Co. | 0.07 | 0.69 | 21.73 | 18.99 | 2.3402 | 0.1010 | |||
| CAT / Caterpillar Inc. | 0.06 | 0.29 | 21.58 | 18.05 | 2.3245 | 0.0824 | |||
| CRWD / CrowdStrike Holdings, Inc. | 0.04 | -2.51 | 19.62 | 40.84 | 2.1134 | 0.4047 | |||
| HD / The Home Depot, Inc. | 0.05 | 3.67 | 19.57 | 3.71 | 2.1081 | -0.2065 | |||
| WMT / Walmart Inc. | 0.20 | 1.80 | 19.56 | 13.38 | 2.1071 | -0.0089 | |||
| AMAT / Applied Materials, Inc. | 0.10 | 1.91 | 18.51 | 28.57 | 1.9933 | 0.2279 | |||
| CRM / Salesforce, Inc. | 0.07 | 0.51 | 17.80 | 2.13 | 1.9168 | -0.2201 | |||
| V / Visa Inc. | 0.05 | 0.30 | 16.09 | 1.62 | 1.7328 | -0.2088 | |||
| BRK.B / Berkshire Hathaway Inc. | 0.03 | 1.27 | 15.68 | -7.63 | 1.6894 | -0.3932 | |||
| COF / Capital One Financial Corporation | 0.07 | 0.76 | 15.65 | 19.56 | 1.6858 | 0.0804 | |||
| EVR / Evercore Inc. | 0.06 | 4.90 | 15.14 | 41.83 | 1.6304 | 0.3214 | |||
| ABBV / AbbVie Inc. | 0.08 | 5.03 | 15.11 | -6.95 | 1.6279 | -0.3641 | |||
| ABT / Abbott Laboratories | 0.11 | -0.86 | 15.10 | 1.65 | 1.6259 | -0.1953 | |||
| PG / The Procter & Gamble Company | 0.09 | 14.88 | 15.01 | 7.40 | 1.6165 | -0.0973 | |||
| QCOM / QUALCOMM Incorporated | 0.09 | 2.10 | 14.09 | 5.86 | 1.5174 | -0.1147 | |||
| BAC / Bank of America Corporation | 0.30 | 5.95 | 14.05 | 20.15 | 1.5135 | 0.0791 | |||
| CB / Chubb Limited | 0.05 | 0.66 | 13.96 | -3.43 | 1.5032 | -0.2692 | |||
| PEP / PepsiCo, Inc. | 0.11 | 17.00 | 13.90 | 3.04 | 1.4970 | -0.1573 | |||
| LLY / Eli Lilly and Company | 0.02 | 9.70 | 13.50 | 3.54 | 1.4544 | -0.1451 | |||
| SHW / The Sherwin-Williams Company | 0.04 | 0.80 | 13.44 | -0.88 | 1.4479 | -0.2155 | |||
| SO / The Southern Company | 0.15 | 1.37 | 13.32 | 1.24 | 1.4346 | -0.1789 | |||
| MRK / Merck & Co., Inc. | 0.17 | 15.59 | 13.23 | 1.94 | 1.4248 | -0.1667 | |||
| VRTX / Vertex Pharmaceuticals Incorporated | 0.03 | 7.48 | 13.18 | -1.30 | 1.4201 | -0.2182 | |||
| DAL / Delta Air Lines, Inc. | 0.26 | 8.15 | 12.88 | 21.99 | 1.3870 | 0.0924 | |||
| TMO / Thermo Fisher Scientific Inc. | 0.03 | 1.45 | 12.71 | -17.34 | 1.3689 | -0.5166 | |||
| MPC / Marathon Petroleum Corporation | 0.08 | 0.37 | 12.66 | 14.44 | 1.3641 | 0.0069 | |||
| FI / Fiserv, Inc. | 0.07 | 4.71 | 12.25 | -18.25 | 1.3196 | -0.5184 | |||
| FCX / Freeport-McMoRan Inc. | 0.28 | 3.55 | 12.07 | 18.57 | 1.2998 | 0.0515 | |||
| FE / FirstEnergy Corp. | 0.29 | 0.33 | 11.84 | -0.07 | 1.2754 | -0.1778 | |||
| DIS / The Walt Disney Company | 0.10 | 1.71 | 11.81 | 27.79 | 1.2719 | 0.1386 | |||
| GM / General Motors Company | 0.24 | 5.92 | 11.69 | 10.83 | 1.2587 | -0.0344 | |||
| DUK / Duke Energy Corporation | 0.10 | 0.73 | 11.61 | -2.55 | 1.2508 | -0.2106 | |||
| PSX / Phillips 66 | 0.09 | 2.11 | 10.75 | -1.35 | 1.1577 | -0.1785 | |||
| EQIX / Equinix, Inc. | 0.01 | 0.54 | 10.60 | -1.91 | 1.1415 | -0.1835 | |||
| CVX / Chevron Corporation | 0.07 | 0.55 | 10.42 | -13.94 | 1.1222 | -0.3624 | |||
| PLD / Prologis, Inc. | 0.08 | 7.39 | 8.28 | 0.98 | 0.8923 | -0.1138 | |||
| LMT / Lockheed Martin Corporation | 0.02 | 8.22 | 0.8854 | 0.8854 | |||||
| MDT / Medtronic plc | 0.09 | 8.07 | 0.8694 | 0.8694 | |||||
| EME / EMCOR Group, Inc. | 0.01 | -55.31 | 7.93 | -35.33 | 0.8546 | -0.6501 | |||
| LRCX / Lam Research Corporation | 0.05 | 0.81 | 4.58 | 34.99 | 0.4929 | 0.0771 | |||
| TJX / The TJX Companies, Inc. | 0.03 | 0.36 | 4.31 | 1.77 | 0.4647 | -0.0553 | |||
| UNH / UnitedHealth Group Incorporated | 0.01 | -73.09 | 2.63 | -83.97 | 0.2828 | -1.7259 | |||
| SPG / Simon Property Group, Inc. | 0.01 | -0.28 | 2.00 | -3.47 | 0.2157 | -0.0387 | |||
| ORLY / O'Reilly Automotive, Inc. | 0.01 | 1,405.43 | 1.12 | -5.31 | 0.1210 | -0.0245 | |||
| AMT / American Tower Corporation | 0.00 | 0.00 | 1.03 | 1.59 | 0.1105 | -0.0134 | |||
| IBIT / iShares Bitcoin Trust ETF | 0.01 | 0.00 | 0.85 | 30.82 | 0.0915 | 0.0118 | |||
| LOW / Lowe's Companies, Inc. | 0.00 | 0.00 | 0.54 | -4.77 | 0.0581 | -0.0114 | |||
| SPY / SPDR S&P 500 ETF | 0.00 | 3.14 | 0.39 | 14.20 | 0.0416 | 0.0000 | |||
| ADBE / Adobe Inc. | 0.00 | -74.12 | 0.27 | -73.94 | 0.0293 | -0.0983 | |||
| XOM / Exxon Mobil Corporation | 0.00 | 0.47 | 0.23 | -9.09 | 0.0248 | -0.0062 | |||
| PSA.PRJ / Public Storage - Preferred Stock | 0.01 | 0.00 | 0.22 | -5.15 | 0.0238 | -0.0049 | |||
| SWGXX / Charles Schwab Family Of Funds - Schwab Government Securities Fund | 0.21 | 0.21 | 0.0227 | 0.0227 | |||||
| APOS / Apollo Global Management, Inc. - Corporate Bond/Note | 0.01 | 0.00 | 0.21 | 0.48 | 0.0224 | -0.0030 | |||
| GOOG / Alphabet Inc. | 0.00 | 0.21 | 0.0224 | 0.0224 | |||||
| JP Morgan PFD / PFD (48125E207) | 0.01 | 0.20 | 0.0000 | ||||||
| ALL / The Allstate Corporation | 0.00 | 0.00 | 0.20 | -2.90 | 0.0217 | -0.0037 | |||
| USB.PRR / U.S. Bancorp - Preferred Stock | 0.01 | 0.00 | 0.19 | -2.53 | 0.0208 | -0.0035 | |||
| BAC.PRO / Bank of America Corporation - Preferred Stock | 0.01 | 0.00 | 0.18 | -2.72 | 0.0193 | -0.0033 | |||
| OMC / Omnicom Group Inc. | 0.00 | -100.00 | 0.00 | 0.0000 | |||||
| Invesco Gold & Special Mnrls / MMF (00143N750) | 0.00 | -100.00 | 0.00 | 0.0000 | |||||
| TSLA / Tesla, Inc. | 0.00 | -100.00 | 0.00 | 0.0000 |