Basic Stats
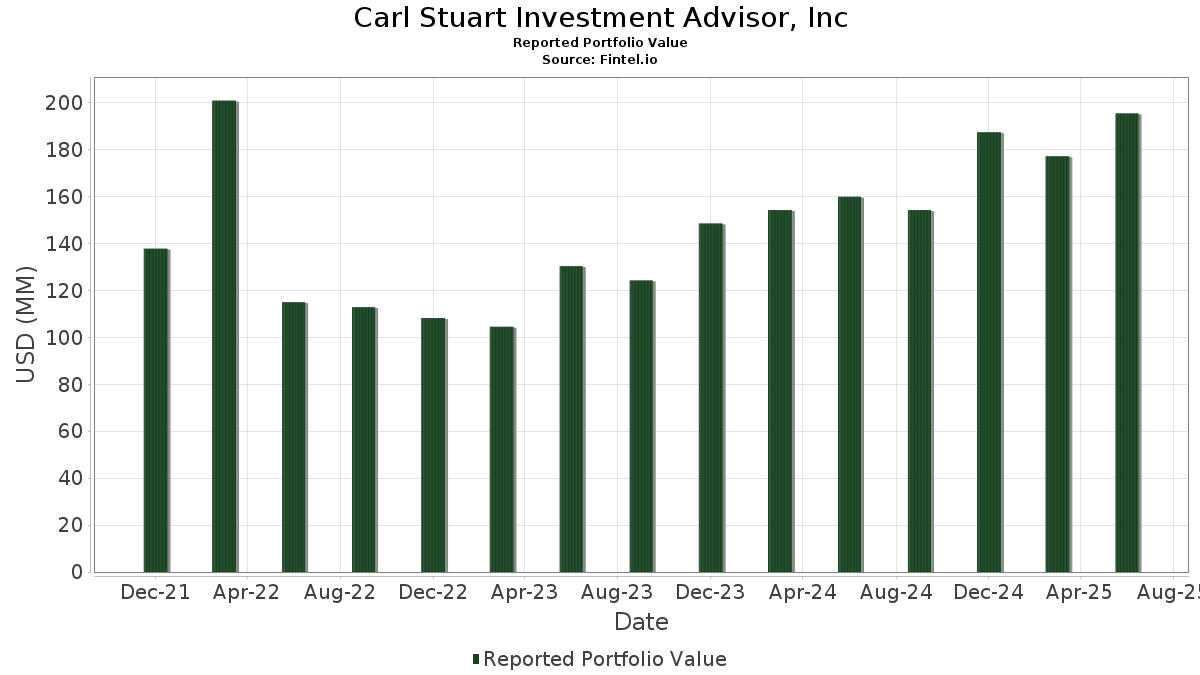
| Portfolio Value | $ 195,399,371 |
| Current Positions | 18 |
Latest Holdings, Performance, AUM (from 13F, 13D)
Carl Stuart Investment Advisor, Inc has disclosed 18 total holdings in their latest SEC filings. Most recent portfolio value is calculated to be $ 195,399,371 USD. Actual Assets Under Management (AUM) is this value plus cash (which is not disclosed). Carl Stuart Investment Advisor, Inc’s top holdings are Vanguard Index Funds - Vanguard Total Stock Market ETF (US:VTI) , iShares Gold Trust (US:IAU) , Vanguard STAR Funds - Vanguard Total International Stock ETF (US:VXUS) , Vanguard Index Funds - Vanguard S&P 500 ETF (US:VOO) , and Raymond James Financial, Inc. (US:RJF) . Carl Stuart Investment Advisor, Inc’s new positions include iShares Gold Trust Micro (US:IAUM) , Meta Platforms, Inc. (US:META) , .
Top Increases This Quarter
We use the change in the portfolio allocation because this is the most meaningful metric. Changes can be due to trades or changes in share prices.
| Security | Shares (MM) |
Value (MM$) |
Portfolio % | ΔPortfolio % |
|---|---|---|---|---|
| 0.33 | 99.66 | 51.0010 | 0.9298 | |
| 0.34 | 23.58 | 12.0652 | 0.5079 | |
| 0.01 | 0.27 | 0.1359 | 0.1359 | |
| 0.00 | 0.20 | 0.1033 | 0.1033 | |
| 0.00 | 0.79 | 0.4064 | 0.0682 | |
| 0.01 | 2.47 | 1.2651 | 0.0467 | |
| 0.01 | 0.39 | 0.2006 | 0.0024 | |
| 0.03 | 4.37 | 2.2350 | 0.0021 |
Top Decreases This Quarter
We use the change in the portfolio allocation because this is the most meaningful metric. Changes can be due to trades or changes in share prices.
| Security | Shares (MM) |
Value (MM$) |
Portfolio % | ΔPortfolio % |
|---|---|---|---|---|
| 0.59 | 36.83 | 18.8510 | -1.4665 | |
| 0.01 | 1.32 | 0.6736 | -0.1223 | |
| 0.04 | 23.56 | 12.0567 | -0.0998 | |
| 0.00 | 0.23 | 0.1198 | -0.0324 | |
| 0.00 | 0.23 | 0.1177 | -0.0233 | |
| 0.00 | 0.45 | 0.2317 | -0.0215 | |
| 0.00 | 0.22 | 0.1124 | -0.0138 | |
| 0.00 | 0.38 | 0.1947 | -0.0083 | |
| 0.01 | 0.23 | 0.1157 | -0.0081 | |
| 0.00 | 0.22 | 0.1142 | -0.0001 |
13F and Fund Filings
This form was filed on 2025-07-25 for the reporting period 2025-06-30. Click the link icon to see the full transaction history.
Upgrade to unlock premium data and export to Excel ![]() .
.
| Security | Type | Avg Share Price | Shares (MM) |
ΔShares (%) |
ΔShares (%) |
Value ($MM) |
Portfolio (%) |
ΔPortfolio (%) |
|
|---|---|---|---|---|---|---|---|---|---|
| VTI / Vanguard Index Funds - Vanguard Total Stock Market ETF | 0.33 | 1.60 | 99.66 | 12.36 | 51.0010 | 0.9298 | |||
| IAU / iShares Gold Trust | 0.59 | -3.23 | 36.83 | 2.35 | 18.8510 | -1.4665 | |||
| VXUS / Vanguard STAR Funds - Vanguard Total International Stock ETF | 0.34 | 3.50 | 23.58 | 15.16 | 12.0652 | 0.5079 | |||
| VOO / Vanguard Index Funds - Vanguard S&P 500 ETF | 0.04 | -1.02 | 23.56 | 9.40 | 12.0567 | -0.0998 | |||
| RJF / Raymond James Financial, Inc. | 0.03 | 0.00 | 4.37 | 10.42 | 2.2350 | 0.0021 | |||
| VOT / Vanguard Index Funds - Vanguard Mid-Cap Growth ETF | 0.01 | -1.47 | 2.47 | 14.50 | 1.2651 | 0.0467 | |||
| XOM / Exxon Mobil Corporation | 0.01 | 2.99 | 1.32 | -6.60 | 0.6736 | -0.1223 | |||
| MSFT / Microsoft Corporation | 0.00 | 0.06 | 0.79 | 32.55 | 0.4064 | 0.0682 | |||
| ADP / Automatic Data Processing, Inc. | 0.00 | 0.00 | 0.45 | 0.89 | 0.2317 | -0.0215 | |||
| VEU / Vanguard International Equity Index Funds - Vanguard FTSE All-World ex-US ETF | 0.01 | 0.73 | 0.39 | 11.40 | 0.2006 | 0.0024 | |||
| GLD / SPDR Gold Trust | 0.00 | 0.00 | 0.38 | 5.85 | 0.1947 | -0.0083 | |||
| IAUM / iShares Gold Trust Micro | 0.01 | 0.27 | 0.1359 | 0.1359 | |||||
| TRGP / Targa Resources Corp. | 0.00 | 0.00 | 0.23 | -13.01 | 0.1198 | -0.0324 | |||
| JNJ / Johnson & Johnson | 0.00 | 0.00 | 0.23 | -7.63 | 0.1177 | -0.0233 | |||
| OBK / Origin Bancorp, Inc. | 0.01 | 0.00 | 0.23 | 3.20 | 0.1157 | -0.0081 | |||
| RTX / RTX Corporation | 0.00 | 0.00 | 0.22 | 10.40 | 0.1142 | -0.0001 | |||
| AAPL / Apple Inc. | 0.00 | 6.26 | 0.22 | -1.79 | 0.1124 | -0.0138 | |||
| META / Meta Platforms, Inc. | 0.00 | 0.20 | 0.1033 | 0.1033 |