Basic Stats
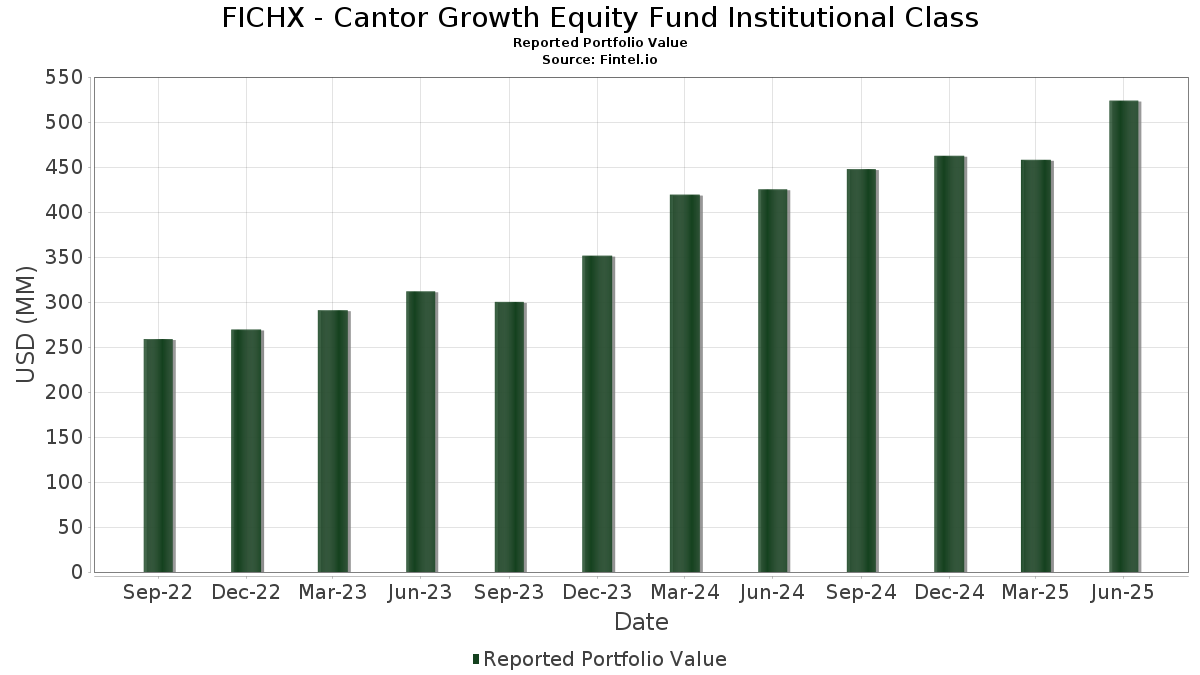
| Portfolio Value | $ 523,846,424 |
| Current Positions | 41 |
Latest Holdings, Performance, AUM (from 13F, 13D)
FICHX - Cantor Growth Equity Fund Institutional Class has disclosed 41 total holdings in their latest SEC filings. Most recent portfolio value is calculated to be $ 523,846,424 USD. Actual Assets Under Management (AUM) is this value plus cash (which is not disclosed). FICHX - Cantor Growth Equity Fund Institutional Class’s top holdings are Microsoft Corporation (US:MSFT) , Broadcom Inc. (US:AVGO) , Meta Platforms, Inc. (US:META) , Costco Wholesale Corporation (US:COST) , and Fidelity Colchester Street Trust - Fidelity Institutional Money Market Funds Government Portfolio Class I (US:FIGXX) . FICHX - Cantor Growth Equity Fund Institutional Class’s new positions include Fidelity Colchester Street Trust - Fidelity Institutional Money Market Funds Government Portfolio Class I (US:FIGXX) , Comfort Systems USA, Inc. (US:FIX) , The Walt Disney Company (US:DIS) , .
Top Increases This Quarter
We use the change in the portfolio allocation because this is the most meaningful metric. Changes can be due to trades or changes in share prices.
| Security | Shares (MM) |
Value (MM$) |
Portfolio % | ΔPortfolio % |
|---|---|---|---|---|
| 0.02 | 11.37 | 2.1704 | 2.1704 | |
| 0.09 | 11.16 | 2.1310 | 2.1310 | |
| 0.08 | 21.46 | 4.0978 | 1.2495 | |
| 0.12 | 11.14 | 2.1279 | 0.8186 | |
| 0.01 | 18.79 | 3.5872 | 0.7693 | |
| 0.05 | 24.93 | 4.7599 | 0.6491 | |
| 0.04 | 14.95 | 2.8548 | 0.5211 | |
| 0.02 | 18.83 | 3.5949 | 0.4728 | |
| 18.90 | 3.6092 | 0.4215 | ||
| 0.03 | 19.22 | 3.6697 | 0.3904 |
Top Decreases This Quarter
We use the change in the portfolio allocation because this is the most meaningful metric. Changes can be due to trades or changes in share prices.
| Security | Shares (MM) |
Value (MM$) |
Portfolio % | ΔPortfolio % |
|---|---|---|---|---|
| 0.00 | 0.00 | -2.0932 | ||
| 0.09 | 18.11 | 3.4581 | -0.7390 | |
| 0.14 | 12.34 | 2.3557 | -0.4289 | |
| 0.02 | 8.01 | 1.5300 | -0.3767 | |
| 0.03 | 9.01 | 1.7206 | -0.3675 | |
| 0.03 | 8.83 | 1.6861 | -0.3513 | |
| 0.02 | 19.13 | 3.6517 | -0.3407 | |
| 0.05 | 7.31 | 1.3955 | -0.3383 | |
| 0.06 | 6.59 | 1.2580 | -0.3302 | |
| 0.09 | 8.97 | 1.7121 | -0.2926 |
13F and Fund Filings
This form was filed on 2025-08-29 for the reporting period 2025-06-30. Click the link icon to see the full transaction history.
Upgrade to unlock premium data and export to Excel ![]() .
.
| Security | Type | Avg Share Price | Shares (MM) |
ΔShares (%) |
ΔShares (%) |
Value ($MM) |
Portfolio (%) |
ΔPortfolio (%) |
|
|---|---|---|---|---|---|---|---|---|---|
| MSFT / Microsoft Corporation | 0.05 | 0.00 | 24.93 | 32.51 | 4.7599 | 0.6491 | |||
| AVGO / Broadcom Inc. | 0.08 | 0.00 | 21.46 | 64.64 | 4.0978 | 1.2495 | |||
| META / Meta Platforms, Inc. | 0.03 | 0.00 | 19.22 | 28.06 | 3.6697 | 0.3904 | |||
| COST / Costco Wholesale Corporation | 0.02 | 0.00 | 19.13 | 4.67 | 3.6517 | -0.3407 | |||
| FIGXX / Fidelity Colchester Street Trust - Fidelity Institutional Money Market Funds Government Portfolio Class I | 18.90 | 29.57 | 3.6092 | 0.4215 | |||||
| KLAC / KLA Corporation | 0.02 | 0.00 | 18.83 | 31.77 | 3.5949 | 0.4728 | |||
| NFLX / Netflix, Inc. | 0.01 | 1.45 | 18.79 | 45.68 | 3.5872 | 0.7693 | |||
| BKNG / Booking Holdings Inc. | 0.00 | 0.00 | 18.58 | 25.66 | 3.5481 | 0.3171 | |||
| PH / Parker-Hannifin Corporation | 0.03 | 0.00 | 18.38 | 14.91 | 3.5087 | 0.0144 | |||
| AAPL / Apple Inc. | 0.09 | 2.08 | 18.11 | -5.72 | 3.4581 | -0.7390 | |||
| AXP / American Express Company | 0.05 | 2.00 | 16.27 | 20.93 | 3.1061 | 0.1668 | |||
| APP / AppLovin Corporation | 0.04 | 5.95 | 14.95 | 39.99 | 2.8548 | 0.5211 | |||
| GOOGL / Alphabet Inc. | 0.08 | 0.00 | 14.51 | 13.96 | 2.7705 | -0.0115 | |||
| MCK / McKesson Corporation | 0.02 | 0.00 | 14.47 | 8.89 | 2.7618 | -0.1408 | |||
| JPM / JPMorgan Chase & Co. | 0.05 | 4.39 | 13.50 | 23.38 | 2.5772 | 0.1868 | |||
| HAS / Hasbro, Inc. | 0.18 | 2.89 | 13.15 | 23.53 | 2.5102 | 0.1846 | |||
| CDNS / Cadence Design Systems, Inc. | 0.04 | 2.53 | 12.51 | 24.23 | 2.3881 | 0.1881 | |||
| ANET / Arista Networks Inc | 0.12 | 0.00 | 12.50 | 32.05 | 2.3857 | 0.3182 | |||
| ACGL / Arch Capital Group Ltd. | 0.14 | 2.26 | 12.34 | -3.19 | 2.3557 | -0.4289 | |||
| HUBB / Hubbell Incorporated | 0.03 | 2.17 | 11.52 | 26.10 | 2.1990 | 0.2035 | |||
| FIX / Comfort Systems USA, Inc. | 0.02 | 11.37 | 2.1704 | 2.1704 | |||||
| EBAY / eBay Inc. | 0.15 | 0.00 | 11.32 | 9.94 | 2.1619 | -0.0885 | |||
| CBOE / Cboe Global Markets, Inc. | 0.05 | 2.11 | 11.30 | 5.23 | 2.1569 | -0.1887 | |||
| MRVL / Marvell Technology, Inc. | 0.15 | 0.00 | 11.23 | 25.71 | 2.1443 | 0.1923 | |||
| DIS / The Walt Disney Company | 0.09 | 11.16 | 2.1310 | 2.1310 | |||||
| SCHW / The Charles Schwab Corporation | 0.12 | 59.57 | 11.14 | 85.98 | 2.1279 | 0.8186 | |||
| TJX / The TJX Companies, Inc. | 0.09 | 2.61 | 10.62 | 4.04 | 2.0279 | -0.2027 | |||
| WDAY / Workday, Inc. | 0.04 | 2.40 | 10.23 | 5.24 | 1.9530 | -0.1706 | |||
| VEEV / Veeva Systems Inc. | 0.03 | 3.63 | 9.95 | 28.83 | 1.8992 | 0.2123 | |||
| MEDP / Medpace Holdings, Inc. | 0.03 | 3.26 | 9.93 | 6.37 | 1.8968 | -0.1438 | |||
| PINS / Pinterest, Inc. | 0.26 | 0.00 | 9.26 | 15.67 | 1.7687 | 0.0190 | |||
| PGR / The Progressive Corporation | 0.03 | 0.00 | 9.01 | -5.71 | 1.7206 | -0.3675 | |||
| OKTA / Okta, Inc. | 0.09 | 2.87 | 8.97 | -2.27 | 1.7121 | -0.2926 | |||
| WAT / Waters Corporation | 0.03 | 0.00 | 8.83 | -5.30 | 1.6861 | -0.3513 | |||
| VRTX / Vertex Pharmaceuticals Incorporated | 0.02 | 0.00 | 8.01 | -8.17 | 1.5300 | -0.3767 | |||
| ADBE / Adobe Inc. | 0.02 | 4.61 | 7.72 | 5.54 | 1.4744 | -0.1245 | |||
| EXLS / ExlService Holdings, Inc. | 0.17 | 4.32 | 7.40 | -3.23 | 1.4137 | -0.2582 | |||
| JNJ / Johnson & Johnson | 0.05 | 0.00 | 7.31 | -7.89 | 1.3955 | -0.3383 | |||
| XOM / Exxon Mobil Corporation | 0.06 | 0.00 | 6.59 | -9.37 | 1.2580 | -0.3302 | |||
| LNW / Light & Wonder, Inc. | 0.06 | 0.00 | 5.55 | 11.16 | 1.0597 | -0.0314 | |||
| MPC / Marathon Petroleum Corporation | 0.03 | 0.00 | 4.90 | 14.03 | 0.9356 | -0.0034 | |||
| GM0N / Globus Medical, Inc. | 0.00 | -100.00 | 0.00 | -100.00 | -2.0932 |