Basic Stats
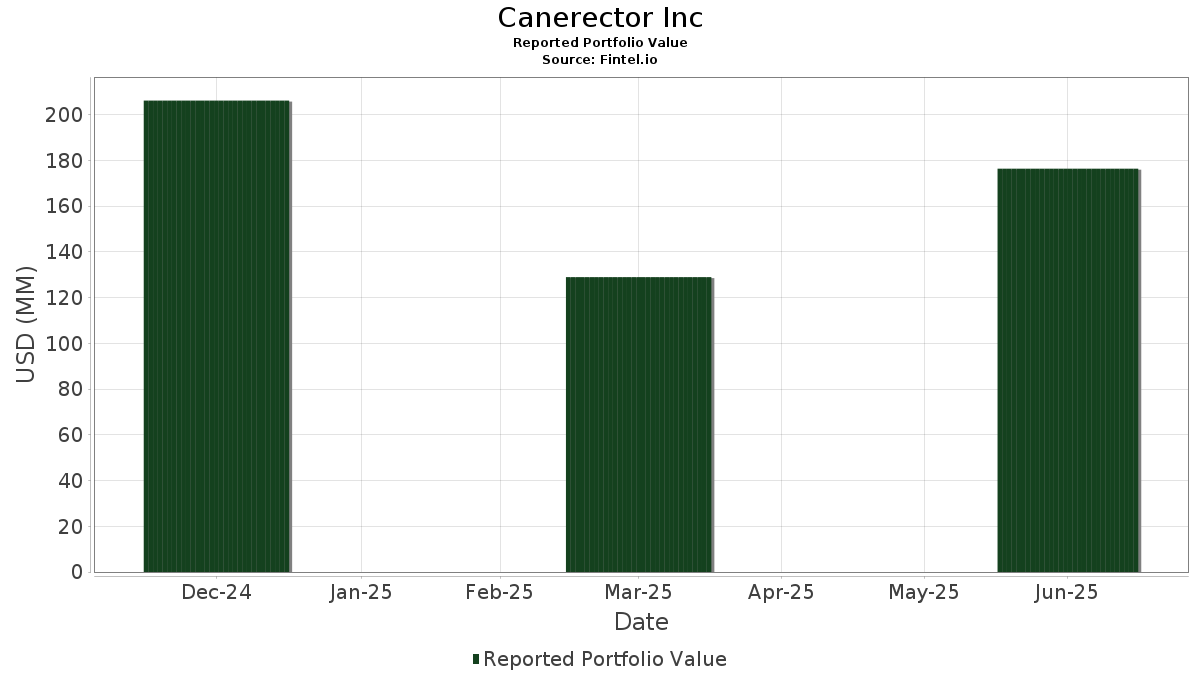
| Portfolio Value | $ 176,333,621 |
| Current Positions | 10 |
Latest Holdings, Performance, AUM (from 13F, 13D)
Canerector Inc has disclosed 10 total holdings in their latest SEC filings. Most recent portfolio value is calculated to be $ 176,333,621 USD. Actual Assets Under Management (AUM) is this value plus cash (which is not disclosed). Canerector Inc’s top holdings are Manulife Financial Corporation (US:MFC) , Vanguard Index Funds - Vanguard S&P 500 ETF (US:VOO) , The Bank of Nova Scotia (US:BNS) , The Toronto-Dominion Bank (US:TD) , and Canadian Imperial Bank of Commerce (US:CM) .
Top Increases This Quarter
We use the change in the portfolio allocation because this is the most meaningful metric. Changes can be due to trades or changes in share prices.
| Security | Shares (MM) |
Value (MM$) |
Portfolio % | ΔPortfolio % |
|---|---|---|---|---|
| 0.62 | 26.99 | 15.3089 | 15.1003 | |
| 0.07 | 11.67 | 6.6156 | 5.7983 |
Top Decreases This Quarter
We use the change in the portfolio allocation because this is the most meaningful metric. Changes can be due to trades or changes in share prices.
| Security | Shares (MM) |
Value (MM$) |
Portfolio % | ΔPortfolio % |
|---|---|---|---|---|
| 0.05 | 25.64 | 14.5411 | -4.2659 | |
| 0.03 | 12.48 | 7.0772 | -3.5354 | |
| 0.30 | 22.59 | 12.8109 | -3.0661 | |
| 0.12 | 18.86 | 10.6978 | -2.6262 | |
| 0.20 | 20.03 | 11.3603 | -2.0168 | |
| 0.25 | 7.55 | 4.2817 | -2.0158 | |
| 0.01 | 11.19 | 6.3432 | -1.7778 | |
| 0.20 | 19.33 | 10.9633 | -1.5947 |
13F and Fund Filings
This form was filed on 2025-07-17 for the reporting period 2025-06-30. Click the link icon to see the full transaction history.
Upgrade to unlock premium data and export to Excel ![]() .
.
| Security | Type | Avg Share Price | Shares (MM) |
ΔShares (%) |
ΔShares (%) |
Value ($MM) |
Portfolio (%) |
ΔPortfolio (%) |
|
|---|---|---|---|---|---|---|---|---|---|
| MFC / Manulife Financial Corporation | 0.62 | 3.33 | 26.99 | 9,934.94 | 15.3089 | 15.1003 | |||
| VOO / Vanguard Index Funds - Vanguard S&P 500 ETF | 0.05 | 0.31 | 25.64 | 5.75 | 14.5411 | -4.2659 | |||
| BNS / The Bank of Nova Scotia | 0.30 | 0.00 | 22.59 | 10.36 | 12.8109 | -3.0661 | |||
| TD / The Toronto-Dominion Bank | 0.20 | 0.00 | 20.03 | 16.15 | 11.3603 | -2.0168 | |||
| CM / Canadian Imperial Bank of Commerce | 0.20 | 0.00 | 19.33 | 19.41 | 10.9633 | -1.5947 | |||
| BMO / Bank of Montreal | 0.12 | 0.00 | 18.86 | 9.82 | 10.6978 | -2.6262 | |||
| BRK.B / Berkshire Hathaway Inc. | 0.03 | 0.00 | 12.48 | -8.79 | 7.0772 | -3.5354 | |||
| RY / Royal Bank of Canada | 0.07 | 0.00 | 11.67 | 1,007.79 | 6.6156 | 5.7983 | |||
| MKL / Markel Group Inc. | 0.01 | 0.00 | 11.19 | 6.84 | 6.3432 | -1.7778 | |||
| BCE / BCE Inc. | 0.25 | 1.71 | 7.55 | -7.00 | 4.2817 | -2.0158 |