Basic Stats
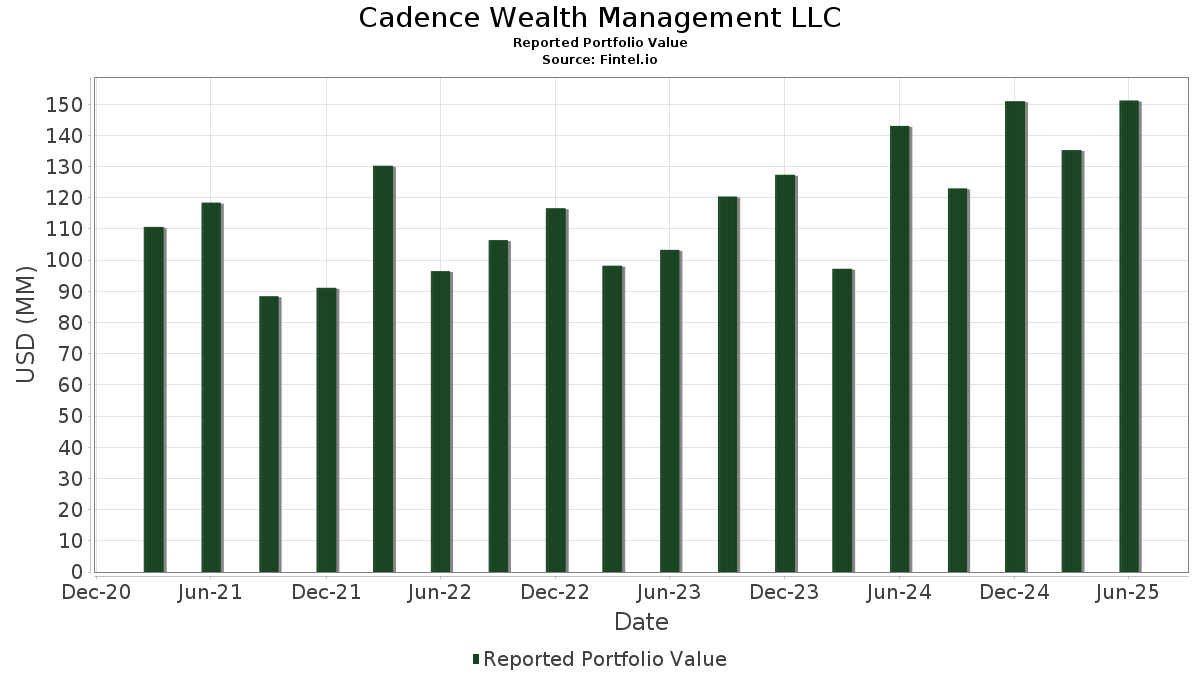
| Portfolio Value | $ 151,185,688 |
| Current Positions | 51 |
Latest Holdings, Performance, AUM (from 13F, 13D)
Cadence Wealth Management LLC has disclosed 51 total holdings in their latest SEC filings. Most recent portfolio value is calculated to be $ 151,185,688 USD. Actual Assets Under Management (AUM) is this value plus cash (which is not disclosed). Cadence Wealth Management LLC’s top holdings are iShares Trust - iShares 20+ Year Treasury Bond ETF (US:TLT) , iShares Silver Trust (US:SLV) , iShares Trust - iShares 7-10 Year Treasury Bond ETF (US:IEF) , SPDR Gold Trust (US:GLD) , and Sprott Physical Gold and Silver Trust (US:CEF) . Cadence Wealth Management LLC’s new positions include J P Morgan Exchange-Traded Fund Trust - Mortgage Backed Secs ETF (US:JMTG) , Barrick Mining Corporation (US:B) , Vale S.A. - Depositary Receipt (Common Stock) (US:VALE) , Albemarle Corporation (US:ALB) , and Chewy, Inc. (US:CHWY) .
Top Increases This Quarter
We use the change in the portfolio allocation because this is the most meaningful metric. Changes can be due to trades or changes in share prices.
| Security | Shares (MM) |
Value (MM$) |
Portfolio % | ΔPortfolio % |
|---|---|---|---|---|
| 0.04 | 1.86 | 1.2284 | 1.2284 | |
| 0.05 | 1.11 | 0.7353 | 0.7353 | |
| 0.19 | 5.27 | 3.4840 | 0.3248 | |
| 0.08 | 4.37 | 2.8900 | 0.2838 | |
| 0.06 | 3.11 | 2.0587 | 0.2652 | |
| 0.04 | 0.40 | 0.2621 | 0.2621 | |
| 0.00 | 0.31 | 0.2023 | 0.2023 | |
| 0.11 | 0.83 | 0.5480 | 0.1852 | |
| 0.00 | 0.25 | 0.1652 | 0.1652 | |
| 0.01 | 0.23 | 0.1536 | 0.1536 |
Top Decreases This Quarter
We use the change in the portfolio allocation because this is the most meaningful metric. Changes can be due to trades or changes in share prices.
| Security | Shares (MM) |
Value (MM$) |
Portfolio % | ΔPortfolio % |
|---|---|---|---|---|
| 0.48 | 42.23 | 27.9303 | -0.9148 | |
| 0.08 | 7.02 | 4.6411 | -0.7593 | |
| 0.12 | 11.75 | 7.7733 | -0.6203 | |
| 0.72 | 23.76 | 15.7154 | -0.5265 | |
| 0.27 | 8.08 | 5.3462 | -0.4070 | |
| 0.02 | 0.76 | 0.5029 | -0.3650 | |
| 0.03 | 3.21 | 2.1240 | -0.2680 | |
| 0.04 | 11.21 | 7.4166 | -0.2287 | |
| 0.01 | 1.05 | 0.6919 | -0.1708 | |
| 0.01 | 1.00 | 0.6638 | -0.1586 |
13F and Fund Filings
This form was filed on 2025-08-12 for the reporting period 2025-06-30. Click the link icon to see the full transaction history.
Upgrade to unlock premium data and export to Excel ![]() .
.