Basic Stats
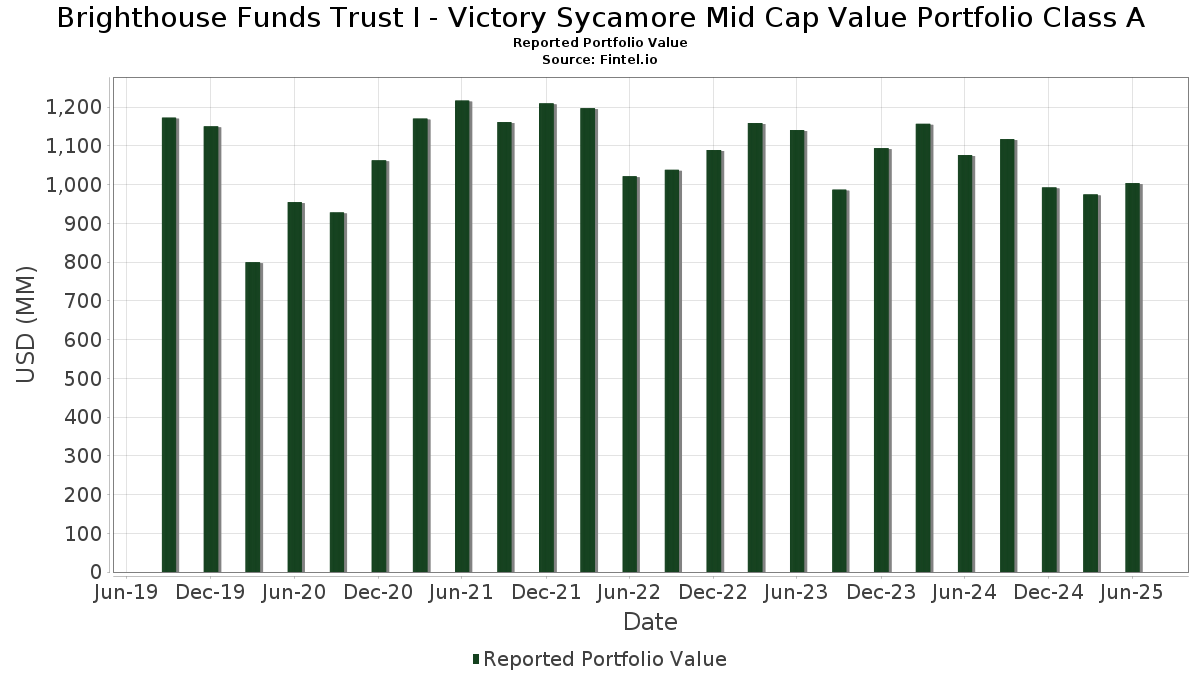
| Portfolio Value | $ 1,003,627,314 |
| Current Positions | 110 |
Latest Holdings, Performance, AUM (from 13F, 13D)
Brighthouse Funds Trust I - Victory Sycamore Mid Cap Value Portfolio Class A has disclosed 110 total holdings in their latest SEC filings. Most recent portfolio value is calculated to be $ 1,003,627,314 USD. Actual Assets Under Management (AUM) is this value plus cash (which is not disclosed). Brighthouse Funds Trust I - Victory Sycamore Mid Cap Value Portfolio Class A’s top holdings are US Foods Holding Corp. (US:USFD) , Alliant Energy Corporation (US:LNT) , Blackrock Liquidity Funds - BlackRock Liquidity Funds FedFund Portfolio Institutional Class (US:TFDXX) , DREYFUS TREASURY PRIME CASH MANAGEMENT/ CLASS A (XX:US2619081076) , and Quest Diagnostics Incorporated (US:DGX) . Brighthouse Funds Trust I - Victory Sycamore Mid Cap Value Portfolio Class A’s new positions include Labcorp Holdings Inc. (US:LH) , Microchip Technology Incorporated (US:MCHP) , Casey's General Stores, Inc. (US:CASY) , CMS Energy Corporation (US:CMS) , and Penske Automotive Group, Inc. (US:PAG) .
Top Increases This Quarter
We use the change in the portfolio allocation because this is the most meaningful metric. Changes can be due to trades or changes in share prices.
| Security | Shares (MM) |
Value (MM$) |
Portfolio % | ΔPortfolio % |
|---|---|---|---|---|
| 30.16 | 3.5060 | 3.5060 | ||
| 20.00 | 20.00 | 2.3251 | 2.2092 | |
| 20.00 | 20.00 | 2.3251 | 2.2092 | |
| 18.00 | 2.0926 | 2.0926 | ||
| 0.05 | 12.76 | 1.4832 | 1.4832 | |
| 10.00 | 1.1626 | 1.1626 | ||
| 10.00 | 1.1626 | 1.1626 | ||
| 0.14 | 9.92 | 1.1535 | 1.1535 | |
| 0.02 | 8.78 | 1.0203 | 1.0203 | |
| 0.12 | 8.48 | 0.9858 | 0.9858 |
Top Decreases This Quarter
We use the change in the portfolio allocation because this is the most meaningful metric. Changes can be due to trades or changes in share prices.
| Security | Shares (MM) |
Value (MM$) |
Portfolio % | ΔPortfolio % |
|---|---|---|---|---|
| 0.01 | 0.61 | 0.0710 | -1.1903 | |
| 0.00 | 0.00 | -0.9113 | ||
| 0.12 | 8.45 | 0.9828 | -0.6026 | |
| 0.12 | 14.93 | 1.7360 | -0.5007 | |
| 0.04 | 5.17 | 0.6007 | -0.4892 | |
| 0.30 | 11.65 | 1.3541 | -0.4661 | |
| 0.13 | 10.08 | 1.1714 | -0.4607 | |
| 0.06 | 4.28 | 0.4981 | -0.4373 | |
| 0.07 | 11.00 | 1.2787 | -0.4248 | |
| 0.34 | 20.63 | 2.3986 | -0.3209 |
13F and Fund Filings
This form was filed on 2025-08-27 for the reporting period 2025-06-30. Click the link icon to see the full transaction history.
Upgrade to unlock premium data and export to Excel ![]() .
.
| Security | Type | Avg Share Price | Shares (MM) |
ΔShares (%) |
ΔShares (%) |
Value ($MM) |
Portfolio (%) |
ΔPortfolio (%) |
|
|---|---|---|---|---|---|---|---|---|---|
| FIXED INC CLEARING CORP.REPO / RA (000000000) | 30.16 | 3.5060 | 3.5060 | ||||||
| USFD / US Foods Holding Corp. | 0.27 | -10.87 | 21.15 | 4.86 | 2.4594 | 0.1215 | |||
| LNT / Alliant Energy Corporation | 0.34 | -6.44 | 20.63 | -12.08 | 2.3986 | -0.3209 | |||
| TFDXX / Blackrock Liquidity Funds - BlackRock Liquidity Funds FedFund Portfolio Institutional Class | 20.00 | 1,900.00 | 20.00 | 1,900.00 | 2.3251 | 2.2092 | |||
| US2619081076 / DREYFUS TREASURY PRIME CASH MANAGEMENT/ CLASS A | 20.00 | 1,900.00 | 20.00 | 1,900.00 | 2.3251 | 2.2092 | |||
| US63306A4114 / National Bank of Canada into Bristol-Myers Squibb Co. | 18.00 | 2.0926 | 2.0926 | ||||||
| DGX / Quest Diagnostics Incorporated | 0.09 | -13.20 | 16.89 | -7.85 | 1.9630 | -0.1604 | |||
| CCK / Crown Holdings, Inc. | 0.16 | -14.23 | 16.83 | -1.05 | 1.9562 | -0.0142 | |||
| FNF / Fidelity National Financial, Inc. | 0.29 | 9.09 | 16.15 | -6.03 | 1.8770 | -0.1139 | |||
| PFGC / Performance Food Group Company | 0.18 | 5.26 | 16.09 | 17.10 | 1.8711 | 0.2784 | |||
| WTY / Willis Towers Watson Public Limited Company | 0.05 | -0.97 | 15.72 | -10.18 | 1.8279 | -0.2006 | |||
| G / Genpact Limited | 0.35 | 1.01 | 15.47 | -11.76 | 1.7979 | -0.2331 | |||
| EXPE / Expedia Group, Inc. | 0.09 | -6.59 | 15.30 | -6.27 | 1.7786 | -0.1128 | |||
| AWK / American Water Works Company, Inc. | 0.11 | -3.65 | 15.07 | -9.14 | 1.7515 | -0.1700 | |||
| HIG / The Hartford Insurance Group, Inc. | 0.12 | -24.55 | 14.93 | -22.64 | 1.7360 | -0.5007 | |||
| CPT / Camden Property Trust | 0.13 | -1.07 | 14.57 | -8.85 | 1.6939 | -0.1583 | |||
| NNN / NNN REIT, Inc. | 0.34 | -8.13 | 14.49 | -6.99 | 1.6847 | -0.1207 | |||
| TRMB / Trimble Inc. | 0.19 | 2.76 | 14.44 | 18.92 | 1.6792 | 0.2718 | |||
| CART / Maplebear Inc. | 0.31 | 19.32 | 14.19 | 35.32 | 1.6499 | 0.4346 | |||
| LAMR / Lamar Advertising Company | 0.12 | -1.68 | 14.17 | 4.86 | 1.6479 | 0.0816 | |||
| HBAN / Huntington Bancshares Incorporated | 0.81 | 2.57 | 13.66 | 14.53 | 1.5880 | 0.2059 | |||
| SBAC / SBA Communications Corporation | 0.06 | -18.35 | 13.48 | -12.85 | 1.5671 | -0.2252 | |||
| CTRA / Coterra Energy Inc. | 0.53 | -1.94 | 13.37 | -13.88 | 1.5541 | -0.2446 | |||
| ORI / Old Republic International Corporation | 0.34 | -1.77 | 13.23 | -3.72 | 1.5377 | -0.0543 | |||
| XYL / Xylem Inc. | 0.10 | 23.78 | 13.13 | 34.05 | 1.5264 | 0.3913 | |||
| TFC / Truist Financial Corporation | 0.30 | 42.56 | 13.06 | 48.93 | 1.5183 | 0.5022 | |||
| LECO / Lincoln Electric Holdings, Inc. | 0.06 | 30.69 | 12.98 | 43.25 | 1.5088 | 0.4588 | |||
| BBWI / Bath & Body Works, Inc. | 0.43 | 93.01 | 12.83 | 90.73 | 1.4911 | 0.7118 | |||
| HOLX / Hologic, Inc. | 0.20 | -16.75 | 12.76 | -12.18 | 1.4832 | -0.2003 | |||
| LH / Labcorp Holdings Inc. | 0.05 | 12.76 | 1.4832 | 1.4832 | |||||
| MKSI / MKS Inc. | 0.13 | 13.03 | 12.76 | 40.11 | 1.4832 | 0.4281 | |||
| CF / CF Industries Holdings, Inc. | 0.14 | -0.43 | 12.69 | 17.21 | 1.4749 | 0.2207 | |||
| RJF / Raymond James Financial, Inc. | 0.08 | 38.53 | 12.68 | 52.95 | 1.4746 | 0.5136 | |||
| ATR / AptarGroup, Inc. | 0.08 | -0.62 | 12.55 | 4.77 | 1.4585 | 0.0709 | |||
| KNX / Knight-Swift Transportation Holdings Inc. | 0.28 | -1.02 | 12.44 | 0.66 | 1.4459 | 0.0142 | |||
| CHKP / Check Point Software Technologies Ltd. | 0.06 | 22.17 | 12.43 | 18.60 | 1.4456 | 0.2306 | |||
| TXT / Textron Inc. | 0.15 | -1.83 | 12.06 | 9.09 | 1.4020 | 0.1210 | |||
| PFG / Principal Financial Group, Inc. | 0.15 | 16.06 | 11.71 | 9.27 | 1.3611 | 0.1195 | |||
| KEYS / Keysight Technologies, Inc. | 0.07 | 3.93 | 11.70 | 13.70 | 1.3601 | 0.1678 | |||
| BKR / Baker Hughes Company | 0.30 | -15.00 | 11.65 | -25.85 | 1.3541 | -0.4661 | |||
| FNV / Franco-Nevada Corporation | 0.07 | -28.08 | 11.00 | -25.18 | 1.2787 | -0.4248 | |||
| AFG / American Financial Group, Inc. | 0.09 | 14.30 | 10.89 | 9.83 | 1.2663 | 0.1172 | |||
| AGCO / AGCO Corporation | 0.10 | -11.09 | 10.83 | -0.92 | 1.2593 | -0.0076 | |||
| AXTA / Axalta Coating Systems Ltd. | 0.36 | -1.71 | 10.78 | -12.02 | 1.2536 | -0.1666 | |||
| RPM / RPM International Inc. | 0.10 | -1.91 | 10.71 | -6.86 | 1.2450 | -0.0874 | |||
| HUBB / Hubbell Incorporated | 0.03 | 106.32 | 10.66 | 154.63 | 1.2392 | 0.7542 | |||
| ELS / Equity LifeStyle Properties, Inc. | 0.17 | -0.42 | 10.31 | -7.93 | 1.1980 | -0.0989 | |||
| WLK / Westlake Corporation | 0.13 | -5.75 | 10.08 | -28.46 | 1.1714 | -0.4607 | |||
| CHRD / Chord Energy Corporation | 0.10 | -2.08 | 10.01 | -15.87 | 1.1642 | -0.2151 | |||
| CF Secured LLC / RA (000000000) | 10.00 | 1.1626 | 1.1626 | ||||||
| NBC Global Finance Limited / RA (000000000) | 10.00 | 1.1626 | 1.1626 | ||||||
| AKAM / Akamai Technologies, Inc. | 0.12 | -3.93 | 9.95 | -4.80 | 1.1572 | -0.0545 | |||
| MIDD / The Middleby Corporation | 0.07 | -14.16 | 9.95 | -18.67 | 1.1568 | -0.2609 | |||
| MCHP / Microchip Technology Incorporated | 0.14 | 9.92 | 1.1535 | 1.1535 | |||||
| TRU / TransUnion | 0.11 | -1.07 | 9.79 | 4.90 | 1.1376 | 0.0567 | |||
| ZBRA / Zebra Technologies Corporation | 0.03 | -20.31 | 9.44 | -13.04 | 1.0970 | -0.1604 | |||
| BWA / BorgWarner Inc. | 0.28 | -19.01 | 9.35 | -5.36 | 1.0875 | -0.0579 | |||
| PRMB / Primo Brands Corporation | 0.31 | 64.13 | 9.19 | 36.99 | 1.0682 | 0.2909 | |||
| JBHT / J.B. Hunt Transport Services, Inc. | 0.06 | -13.78 | 9.08 | -16.31 | 1.0551 | -0.2016 | |||
| PKG / Packaging Corporation of America | 0.05 | 3.30 | 8.84 | -1.69 | 1.0275 | -0.0143 | |||
| STLD / Steel Dynamics, Inc. | 0.07 | 20.77 | 8.78 | 23.61 | 1.0209 | 0.1976 | |||
| CASY / Casey's General Stores, Inc. | 0.02 | 8.78 | 1.0203 | 1.0203 | |||||
| CARR / Carrier Global Corporation | 0.12 | -23.47 | 8.69 | -11.65 | 1.0100 | -0.1295 | |||
| FCN / FTI Consulting, Inc. | 0.05 | -5.83 | 8.61 | -7.31 | 1.0007 | -0.0754 | |||
| RRX / Regal Rexnord Corporation | 0.06 | -26.03 | 8.57 | -5.82 | 0.9960 | -0.0581 | |||
| CMS / CMS Energy Corporation | 0.12 | 8.48 | 0.9858 | 0.9858 | |||||
| COO / The Cooper Companies, Inc. | 0.12 | -26.76 | 8.45 | -38.21 | 0.9828 | -0.6026 | |||
| GPK / Graphic Packaging Holding Company | 0.40 | 37.79 | 8.43 | 11.84 | 0.9798 | 0.1065 | |||
| LSTR / Landstar System, Inc. | 0.06 | -1.36 | 8.08 | -8.69 | 0.9390 | -0.0862 | |||
| DVN / Devon Energy Corporation | 0.25 | -1.28 | 8.07 | -16.04 | 0.9386 | -0.1757 | |||
| AVY / Avery Dennison Corporation | 0.04 | -17.11 | 7.65 | -18.28 | 0.8894 | -0.1954 | |||
| RSG / Republic Services, Inc. | 0.03 | 2.47 | 7.15 | 4.35 | 0.8314 | 0.0373 | |||
| HLT / Hilton Worldwide Holdings Inc. | 0.03 | -0.75 | 7.06 | 16.18 | 0.8205 | 0.1165 | |||
| RL / Ralph Lauren Corporation | 0.02 | -29.06 | 6.23 | -11.85 | 0.7238 | -0.0947 | |||
| US83370G5999 / Societe Generale SA, ELN, (linked to Nasdaq 100 Index) | 6.00 | 0.6975 | 0.6975 | ||||||
| PAG / Penske Automotive Group, Inc. | 0.03 | 5.81 | 0.6751 | 0.6751 | |||||
| Aptiv PLC / EC (JE00BTDN8H13) | 0.08 | -19.73 | 5.61 | -7.96 | 0.6519 | -0.0541 | |||
| ROST / Ross Stores, Inc. | 0.04 | -44.97 | 5.17 | -45.07 | 0.6007 | -0.4892 | |||
| GLOB / Globant S.A. | 0.05 | -12.98 | 4.93 | -32.85 | 0.5734 | -0.2778 | |||
| US25160RLM33 / MD ST GO DB-8076 Q=DB D7 | 4.78 | 0.5559 | 0.5559 | ||||||
| PB / Prosperity Bancshares, Inc. | 0.06 | -46.07 | 4.28 | -46.92 | 0.4981 | -0.4373 | |||
| BANCO SANTANDER SA NY / STIV (000000000) | 4.00 | 0.4650 | 0.4650 | ||||||
| TD Prime Services LLC / RA (000000000) | 4.00 | 0.4650 | 0.4650 | ||||||
| Citigroup Global Markets Inc / RA (000000000) | 4.00 | 0.4650 | 0.4650 | ||||||
| BNSB34 / The Bank of Nova Scotia - Depositary Receipt (Common Stock) | 4.00 | 0.4650 | 0.4650 | ||||||
| Royal Bank Canada Toronto / RA (000000000) | 3.00 | 0.3488 | 0.3488 | ||||||
| BANK OF AMERICA NA / STIV (000000000) | 3.00 | 0.3488 | 0.3488 | ||||||
| CREDIT AGRICOLE SA LONDON / STIV (000000000) | 2.99 | 0.3471 | 0.3471 | ||||||
| WESTPAC BKG CORP, NEW YORK / STIV (000000000) | 2.00 | 0.2328 | 0.2328 | ||||||
| SOCIETE GENERALE NEW YORK / STIV (000000000) | 2.00 | 0.2326 | 0.2326 | ||||||
| CREDIT AGRICOLE CIB, NY / STIV (000000000) | 2.00 | 0.2325 | 0.2325 | ||||||
| FIRST ABU DHABI BANK USA NV / STIV (000000000) | 2.00 | 0.2325 | 0.2325 | ||||||
| MIZUHO BANK LIMITED NEW YORK / STIV (000000000) | 2.00 | 0.2325 | 0.2325 | ||||||
| BNP PARIBAS, NY / STIV (000000000) | 2.00 | 0.2325 | 0.2325 | ||||||
| IONIC SER III CL A / STIV (000000000) | 2.00 | 0.2324 | 0.2324 | ||||||
| SALISBURY RECEIVABLES COMPANY LLC / STIV (000000000) | 2.00 | 0.2321 | 0.2321 | ||||||
| SVENSKA NY / STIV (000000000) | 1.50 | 0.1744 | 0.1744 | ||||||
| COMMONWEALTH BANK AUS, NEW YORK / STIV (000000000) | 1.00 | 0.1164 | 0.1164 | ||||||
| TORONTO DOMINION NY / STIV (000000000) | 1.00 | 0.1163 | 0.1163 | ||||||
| SUMITOMO MITSUI BANKING CORP NY / STIV (000000000) | 1.00 | 0.1163 | 0.1163 | ||||||
| RABOBANK LONDON / STIV (000000000) | 1.00 | 0.1163 | 0.1163 | ||||||
| OCBC NEW YORK / STIV (000000000) | 1.00 | 0.1163 | 0.1163 | ||||||
| Royal Bank Canada Toronto / RA (000000000) | 1.00 | 0.1163 | 0.1163 | ||||||
| BANK OF MONTREAL, LONDON / STIV (000000000) | 1.00 | 0.1163 | 0.1163 | ||||||
| OCBC NEW YORK / STIV (000000000) | 1.00 | 0.1163 | 0.1163 | ||||||
| TORONTO DOMINION NY / STIV (000000000) | 1.00 | 0.1162 | 0.1162 | ||||||
| SALISBURY RECEIVABLES COMPANY LLC / STIV (000000000) | 1.00 | 0.1161 | 0.1161 | ||||||
| LIBERTY STREET FUNDING COMPANY / STIV (000000000) | 1.00 | 0.1161 | 0.1161 | ||||||
| IONIC SER III CL A / STIV (000000000) | 1.00 | 0.1160 | 0.1160 | ||||||
| EBAY / eBay Inc. | 0.01 | -94.90 | 0.61 | -94.40 | 0.0710 | -1.1903 | |||
| SKX / Skechers U.S.A., Inc. | 0.00 | -100.00 | 0.00 | -100.00 | -0.9113 |