Basic Stats
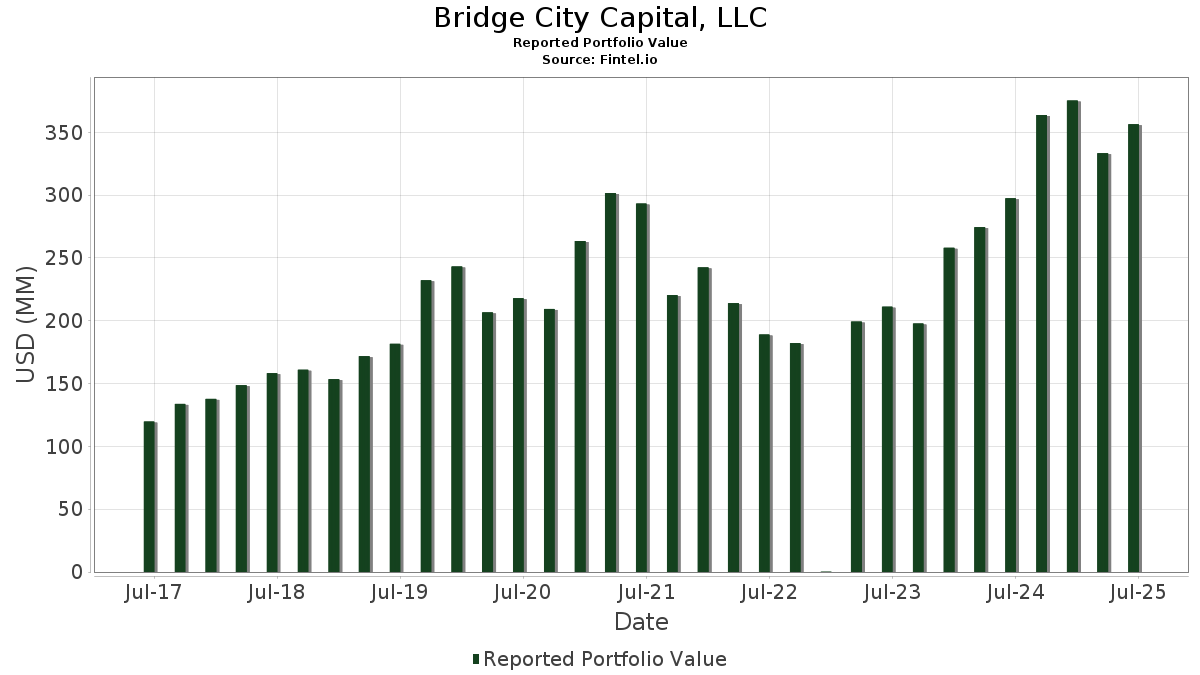
| Portfolio Value | $ 356,496,193 |
| Current Positions | 107 |
Latest Holdings, Performance, AUM (from 13F, 13D)
Bridge City Capital, LLC has disclosed 107 total holdings in their latest SEC filings. Most recent portfolio value is calculated to be $ 356,496,193 USD. Actual Assets Under Management (AUM) is this value plus cash (which is not disclosed). Bridge City Capital, LLC’s top holdings are Sterling Infrastructure, Inc. (US:STRL) , The Ensign Group, Inc. (US:ENSG) , MasTec, Inc. (US:MTZ) , A10 Networks, Inc. (US:ATEN) , and OSI Systems, Inc. (US:OSIS) . Bridge City Capital, LLC’s new positions include Credo Technology Group Holding Ltd (US:CRDO) , Cognex Corporation (GB:0I14) , PJT Partners Inc. (US:PJT) , .
Top Increases This Quarter
We use the change in the portfolio allocation because this is the most meaningful metric. Changes can be due to trades or changes in share prices.
| Security | Shares (MM) |
Value (MM$) |
Portfolio % | ΔPortfolio % |
|---|---|---|---|---|
| 0.05 | 11.69 | 3.2798 | 1.0306 | |
| 0.05 | 8.41 | 2.3596 | 1.0018 | |
| 0.03 | 3.21 | 0.9006 | 0.9006 | |
| 0.09 | 2.72 | 0.7637 | 0.7637 | |
| 0.02 | 7.02 | 1.9683 | 0.5424 | |
| 0.05 | 7.28 | 2.0425 | 0.5256 | |
| 0.01 | 1.70 | 0.4779 | 0.4779 | |
| 0.11 | 4.95 | 1.3883 | 0.4256 | |
| 0.03 | 6.45 | 1.8085 | 0.3029 | |
| 0.12 | 4.57 | 1.2828 | 0.2984 |
Top Decreases This Quarter
We use the change in the portfolio allocation because this is the most meaningful metric. Changes can be due to trades or changes in share prices.
| Security | Shares (MM) |
Value (MM$) |
Portfolio % | ΔPortfolio % |
|---|---|---|---|---|
| 0.02 | 1.43 | 0.4024 | -1.0374 | |
| 0.12 | 6.82 | 1.9120 | -0.6506 | |
| 0.04 | 3.03 | 0.8508 | -0.4509 | |
| 0.03 | 7.62 | 2.1371 | -0.3961 | |
| 0.05 | 5.38 | 1.5086 | -0.2931 | |
| 0.38 | 3.27 | 0.9183 | -0.2853 | |
| 0.17 | 4.12 | 1.1560 | -0.2788 | |
| 0.02 | 7.29 | 2.0461 | -0.2561 | |
| 0.12 | 5.33 | 1.4947 | -0.2464 | |
| 0.08 | 6.00 | 1.6837 | -0.2408 |
13F and Fund Filings
This form was filed on 2025-08-13 for the reporting period 2025-06-30. Click the link icon to see the full transaction history.
Upgrade to unlock premium data and export to Excel ![]() .
.
| Security | Type | Avg Share Price | Shares (MM) |
ΔShares (%) |
ΔShares (%) |
Value ($MM) |
Portfolio (%) |
ΔPortfolio (%) |
|
|---|---|---|---|---|---|---|---|---|---|
| STRL / Sterling Infrastructure, Inc. | 0.05 | -23.50 | 11.69 | 55.91 | 3.2798 | 1.0306 | |||
| ENSG / The Ensign Group, Inc. | 0.07 | -5.73 | 11.23 | 12.39 | 3.1496 | 0.1532 | |||
| MTZ / MasTec, Inc. | 0.05 | 27.23 | 8.41 | 85.80 | 2.3596 | 1.0018 | |||
| ATEN / A10 Networks, Inc. | 0.42 | -1.15 | 8.09 | 17.05 | 2.2685 | 0.1965 | |||
| OSIS / OSI Systems, Inc. | 0.03 | -22.04 | 7.62 | -9.80 | 2.1371 | -0.3961 | |||
| PFGC / Performance Food Group Company | 0.08 | -1.99 | 7.38 | 9.03 | 2.0691 | 0.0400 | |||
| GBCI / Glacier Bancorp, Inc. | 0.17 | 4.98 | 7.31 | 2.27 | 2.0495 | -0.0931 | |||
| RBC / RBC Bearings Incorporated | 0.02 | -20.54 | 7.29 | -4.98 | 2.0461 | -0.2561 | |||
| MTSI / MACOM Technology Solutions Holdings, Inc. | 0.05 | 0.85 | 7.28 | 43.98 | 2.0425 | 0.5256 | |||
| LAD / Lithia Motors, Inc. | 0.02 | -1.05 | 7.09 | 13.88 | 1.9880 | 0.1215 | |||
| FN / Fabrinet | 0.02 | -1.08 | 7.02 | 47.58 | 1.9683 | 0.5424 | |||
| GMED / Globus Medical, Inc. | 0.12 | -1.06 | 6.82 | -20.22 | 1.9120 | -0.6506 | |||
| UFPT / UFP Technologies, Inc. | 0.03 | 6.10 | 6.45 | 28.43 | 1.8085 | 0.3029 | |||
| LMAT / LeMaitre Vascular, Inc. | 0.07 | -1.11 | 6.11 | -2.10 | 1.7134 | -0.1580 | |||
| CBZ / CBIZ, Inc. | 0.08 | -1.05 | 6.00 | -6.47 | 1.6837 | -0.2408 | |||
| DORM / Dorman Products, Inc. | 0.05 | -1.06 | 5.98 | 0.69 | 1.6787 | -0.1039 | |||
| BMI / Badger Meter, Inc. | 0.02 | -14.30 | 5.92 | 10.34 | 1.6607 | 0.0516 | |||
| DIOD / Diodes Incorporated | 0.11 | -1.02 | 5.76 | 21.26 | 1.6145 | 0.1910 | |||
| AIN / Albany International Corp. | 0.08 | -1.05 | 5.74 | 0.51 | 1.6104 | -0.1027 | |||
| MOD / Modine Manufacturing Company | 0.06 | -1.04 | 5.68 | 27.00 | 1.5930 | 0.2519 | |||
| UFPI / UFP Industries, Inc. | 0.05 | -3.56 | 5.38 | -10.49 | 1.5086 | -0.2931 | |||
| EXLS / ExlService Holdings, Inc. | 0.12 | -1.04 | 5.33 | -8.22 | 1.4947 | -0.2464 | |||
| HRMY / Harmony Biosciences Holdings, Inc. | 0.16 | 1.20 | 5.14 | -3.64 | 1.4419 | -0.1581 | |||
| ACIW / ACI Worldwide, Inc. | 0.11 | 83.74 | 4.95 | 54.22 | 1.3883 | 0.4256 | |||
| OLLI / Ollie's Bargain Outlet Holdings, Inc. | 0.04 | -1.41 | 4.77 | 11.67 | 1.3373 | 0.0567 | |||
| IIIN / Insteel Industries, Inc. | 0.12 | -1.52 | 4.57 | 39.31 | 1.2828 | 0.2984 | |||
| FFIN / First Financial Bankshares, Inc. | 0.12 | 14.48 | 4.22 | 14.67 | 1.1839 | 0.0801 | |||
| CCS / Century Communities, Inc. | 0.07 | 19.30 | 4.13 | 0.12 | 1.1573 | -0.0784 | |||
| ARIS / Aris Water Solutions, Inc. | 0.17 | 16.70 | 4.12 | -13.86 | 1.1560 | -0.2788 | |||
| ADUS / Addus HomeCare Corporation | 0.04 | -1.50 | 4.10 | 14.76 | 1.1493 | 0.0784 | |||
| PCRX / Pacira BioSciences, Inc. | 0.17 | -1.44 | 4.06 | -5.19 | 1.1375 | -0.1455 | |||
| USPH / U.S. Physical Therapy, Inc. | 0.05 | -1.50 | 3.91 | 6.45 | 1.0966 | -0.0048 | |||
| PLUS / ePlus inc. | 0.05 | 13.63 | 3.87 | 34.25 | 1.0843 | 0.2207 | |||
| IRMD / IRADIMED CORPORATION | 0.06 | -1.60 | 3.60 | 12.12 | 1.0093 | 0.0467 | |||
| LZB / La-Z-Boy Incorporated | 0.10 | -1.39 | 3.54 | -6.24 | 0.9942 | -0.1395 | |||
| WHD / Cactus, Inc. | 0.08 | -1.41 | 3.52 | -5.96 | 0.9878 | -0.1351 | |||
| LSTR / Landstar System, Inc. | 0.03 | -1.36 | 3.51 | -8.71 | 0.9848 | -0.1685 | |||
| NSSC / Napco Security Technologies, Inc. | 0.12 | -1.40 | 3.51 | 27.18 | 0.9845 | 0.1568 | |||
| EVR / Evercore Inc. | 0.01 | -1.41 | 3.45 | 33.29 | 0.9670 | 0.1914 | |||
| KLIC / Kulicke and Soffa Industries, Inc. | 0.10 | -1.41 | 3.40 | 3.44 | 0.9537 | -0.0321 | |||
| AMED / Amedisys, Inc. | 0.03 | -1.41 | 3.39 | 4.73 | 0.9509 | -0.0199 | |||
| BBSI / Barrett Business Services, Inc. | 0.08 | -1.54 | 3.38 | -0.24 | 0.9468 | -0.0680 | |||
| WTTR / Select Water Solutions, Inc. | 0.38 | -0.87 | 3.27 | -18.44 | 0.9183 | -0.2853 | |||
| CRDO / Credo Technology Group Holding Ltd | 0.03 | 3.21 | 0.9006 | 0.9006 | |||||
| AMPH / Amphastar Pharmaceuticals, Inc. | 0.14 | 19.67 | 3.18 | -5.21 | 0.8929 | -0.1144 | |||
| SITE / SiteOne Landscape Supply, Inc. | 0.03 | -1.38 | 3.17 | -1.77 | 0.8895 | -0.0789 | |||
| WSBC / WesBanco, Inc. | 0.10 | -1.40 | 3.09 | 0.72 | 0.8659 | -0.0532 | |||
| INVX / Innovex International, Inc. | 0.20 | -1.52 | 3.06 | -14.37 | 0.8597 | -0.2135 | |||
| SHAK / Shake Shack Inc. | 0.02 | -20.27 | 3.06 | 27.14 | 0.8582 | 0.1365 | |||
| EXPO / Exponent, Inc. | 0.04 | -24.18 | 3.03 | -30.12 | 0.8508 | -0.4509 | |||
| QLYS / Qualys, Inc. | 0.02 | -1.39 | 2.99 | 11.86 | 0.8386 | 0.0371 | |||
| DFIN / Donnelley Financial Solutions, Inc. | 0.05 | 0.29 | 2.94 | 41.45 | 0.8242 | 0.2012 | |||
| SUPN / Supernus Pharmaceuticals, Inc. | 0.09 | -1.54 | 2.92 | -5.25 | 0.8199 | -0.1051 | |||
| THRM / Gentherm Incorporated | 0.10 | -1.51 | 2.85 | 4.17 | 0.7985 | -0.0208 | |||
| FELE / Franklin Electric Co., Inc. | 0.03 | -1.38 | 2.84 | -5.74 | 0.7968 | -0.1069 | |||
| SPSC / SPS Commerce, Inc. | 0.02 | -1.33 | 2.80 | 1.16 | 0.7846 | -0.0446 | |||
| 0I14 / Cognex Corporation | 0.09 | 2.72 | 0.7637 | 0.7637 | |||||
| NVEC / NVE Corporation | 0.04 | -1.61 | 2.65 | 13.65 | 0.7426 | 0.0438 | |||
| YETI / YETI Holdings, Inc. | 0.08 | 41.91 | 2.63 | 35.15 | 0.7389 | 0.1543 | |||
| PLAB / Photronics, Inc. | 0.14 | 54.00 | 2.59 | 39.69 | 0.7259 | 0.1703 | |||
| JJSF / J&J Snack Foods Corp. | 0.02 | -1.37 | 2.56 | -15.08 | 0.7170 | -0.1858 | |||
| VPG / Vishay Precision Group, Inc. | 0.09 | -1.66 | 2.54 | 14.72 | 0.7127 | 0.0484 | |||
| HCSG / Healthcare Services Group, Inc. | 0.17 | -1.42 | 2.54 | 47.02 | 0.7125 | 0.1942 | |||
| CPRX / Catalyst Pharmaceuticals, Inc. | 0.12 | -1.27 | 2.51 | -11.67 | 0.7054 | -0.1483 | |||
| PLXS / Plexus Corp. | 0.02 | -1.31 | 2.44 | 4.23 | 0.6848 | -0.0177 | |||
| EVTC / EVERTEC, Inc. | 0.07 | -1.42 | 2.43 | -3.38 | 0.6827 | -0.0725 | |||
| GTY / Getty Realty Corp. | 0.08 | -1.40 | 2.30 | -12.58 | 0.6453 | -0.1441 | |||
| AEO / American Eagle Outfitters, Inc. | 0.23 | -1.33 | 2.25 | -18.31 | 0.6321 | -0.1953 | |||
| CNMD / CONMED Corporation | 0.04 | -1.40 | 2.24 | -14.95 | 0.6286 | -0.1618 | |||
| SYNA / Synaptics Incorporated | 0.03 | 54.08 | 2.23 | 56.68 | 0.6252 | 0.1987 | |||
| LKFN / Lakeland Financial Corporation | 0.04 | -1.40 | 2.23 | 1.92 | 0.6251 | -0.0306 | |||
| WDFC / WD-40 Company | 0.01 | -1.38 | 2.16 | -7.85 | 0.6064 | -0.0969 | |||
| MD / Pediatrix Medical Group, Inc. | 0.15 | -1.40 | 2.13 | -2.34 | 0.5979 | -0.0568 | |||
| HOPE / Hope Bancorp, Inc. | 0.19 | -1.42 | 2.08 | 1.07 | 0.5835 | -0.0340 | |||
| CWT / California Water Service Group | 0.05 | -1.40 | 2.08 | -7.45 | 0.5824 | -0.0905 | |||
| ROG / Rogers Corporation | 0.03 | 44.11 | 1.99 | 46.19 | 0.5594 | 0.1501 | |||
| MMS / Maximus, Inc. | 0.03 | -1.41 | 1.96 | 1.50 | 0.5493 | -0.0293 | |||
| UCTT / Ultra Clean Holdings, Inc. | 0.08 | -1.39 | 1.85 | 3.98 | 0.5199 | -0.0148 | |||
| BCC / Boise Cascade Company | 0.02 | -1.40 | 1.83 | -12.74 | 0.5129 | -0.1154 | |||
| PDFS / PDF Solutions, Inc. | 0.08 | 4.82 | 1.79 | 17.30 | 0.5023 | 0.0444 | |||
| KWR / Quaker Chemical Corporation | 0.02 | -1.38 | 1.77 | -10.71 | 0.4959 | -0.0978 | |||
| TXRH / Texas Roadhouse, Inc. | 0.01 | -1.40 | 1.71 | 10.89 | 0.4798 | 0.0172 | |||
| PJT / PJT Partners Inc. | 0.01 | 1.70 | 0.4779 | 0.4779 | |||||
| CCSI / Consensus Cloud Solutions, Inc. | 0.07 | -1.57 | 1.65 | -1.67 | 0.4626 | -0.0403 | |||
| ONTO / Onto Innovation Inc. | 0.02 | 100.84 | 1.64 | 67.07 | 0.4600 | 0.1656 | |||
| HSTM / HealthStream, Inc. | 0.06 | 0.75 | 1.63 | -13.38 | 0.4578 | -0.1072 | |||
| ZD / Ziff Davis, Inc. | 0.05 | -1.40 | 1.53 | -20.59 | 0.4285 | -0.1483 | |||
| LTC / LTC Properties, Inc. | 0.04 | -1.42 | 1.51 | -3.76 | 0.4234 | -0.0469 | |||
| CMCO / Columbus McKinnon Corporation | 0.10 | 0.81 | 1.49 | -9.07 | 0.4192 | -0.0737 | |||
| CORT / Corcept Therapeutics Incorporated | 0.02 | -53.50 | 1.43 | -70.12 | 0.4024 | -1.0374 | |||
| RES / RPC, Inc. | 0.28 | -1.41 | 1.31 | -15.25 | 0.3683 | -0.0961 | |||
| OMCL / Omnicell, Inc. | 0.04 | -1.40 | 1.16 | -17.11 | 0.3264 | -0.0945 | |||
| JACK / Jack in the Box Inc. | 0.05 | -1.53 | 0.86 | -36.81 | 0.2400 | -0.1658 | |||
| MYRG / MYR Group Inc. | 0.00 | -2.48 | 0.85 | 56.41 | 0.2398 | 0.0759 | |||
| CRAI / CRA International, Inc. | 0.00 | -2.47 | 0.77 | 5.49 | 0.2159 | -0.0029 | |||
| PKE / Park Aerospace Corp. | 0.03 | -2.49 | 0.50 | 7.11 | 0.1397 | 0.0002 | |||
| BWFG / Bankwell Financial Group, Inc. | 0.01 | -2.48 | 0.46 | 16.41 | 0.1295 | 0.0106 | |||
| ITIC / Investors Title Company | 0.00 | -15.67 | 0.38 | -26.04 | 0.1053 | -0.0470 | |||
| BGSF / BGSF, Inc. | 0.05 | -2.47 | 0.32 | 69.11 | 0.0907 | 0.0333 | |||
| INTT / inTEST Corporation | 0.04 | -2.49 | 0.31 | 1.62 | 0.0879 | -0.0046 | |||
| JYNT / The Joint Corp. | 0.03 | -2.48 | 0.30 | -9.94 | 0.0841 | -0.0157 | |||
| OSPN / OneSpan Inc. | 0.02 | -2.49 | 0.29 | 6.62 | 0.0816 | -0.0002 | |||
| BMRC / Bank of Marin Bancorp | 0.01 | -2.49 | 0.29 | 1.06 | 0.0805 | -0.0048 | |||
| UTMD / Utah Medical Products, Inc. | 0.00 | -2.48 | 0.28 | -1.05 | 0.0796 | -0.0063 | |||
| IWO / iShares Trust - iShares Russell 2000 Growth ETF | 0.00 | 0.22 | 0.0605 | 0.0605 | |||||
| ARAY / Accuray Incorporated | 0.13 | -2.48 | 0.18 | -25.41 | 0.0512 | -0.0221 | |||
| QIPT / Quipt Home Medical Corp. | 0.05 | -2.48 | 0.09 | -25.00 | 0.0262 | -0.0112 | |||
| PAYS / Paysign, Inc. | 0.00 | -100.00 | 0.00 | 0.0000 | |||||
| NEOG / Neogen Corporation | 0.00 | -100.00 | 0.00 | 0.0000 |