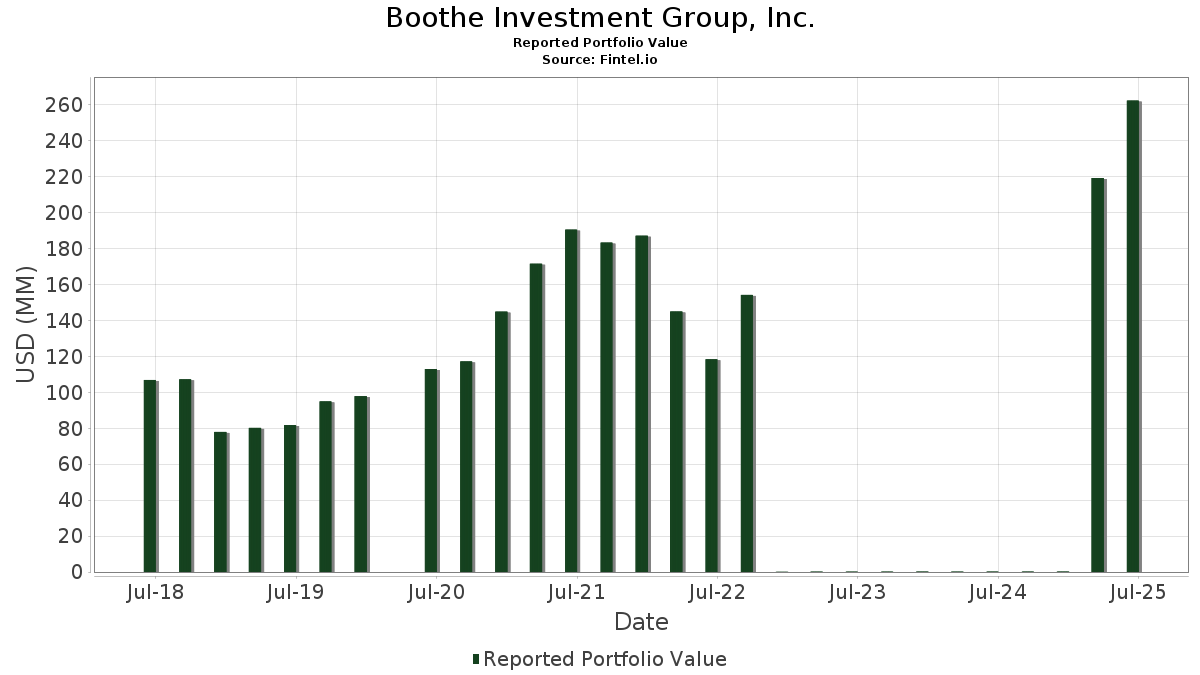
Basic Stats
Portfolio Value $ 262,365,656
Current Positions 39
Latest Holdings, Performance, AUM (from 13F, 13D)

Boothe Investment Group, Inc. has disclosed 39 total holdings in their latest SEC filings. Most recent portfolio value is calculated to be $ 262,365,656 USD. Actual Assets Under Management (AUM) is this value plus cash (which is not disclosed). Boothe Investment Group, Inc.’s top holdings are Simplify Exchange Traded Funds - Simplify Managed Futures Strategy ETF (US:CTA) , DoubleLine ETF Trust - DoubleLine Opportunistic Core Bond ETF (US:DBND) , WisdomTree Trust - WisdomTree Europe Hedged Equity Fund (US:HEDJ) , Victory Portfolios II - VictoryShares Small Cap Free Cash Flow ETF (US:SFLO) , and Global X Funds - Global X FTSE Southeast Asia ETF (US:ASEA) . Boothe Investment Group, Inc.’s new positions include Simplify Exchange Traded Funds - Simplify Managed Futures Strategy ETF (US:CTA) , Global X Funds - Global X India Active ETF (US:NDIA) , Schlumberger Limited (US:SLB) , Vertiv Holdings Co (US:VRT) , and SharkNinja, Inc. (US:SN) .

Boothe Investment Group, Inc. - Portfolio Value
Top Increases This Quarter

We use the change in the portfolio allocation because this is the most meaningful metric. Changes can be due to trades or changes in share prices.

Security Shares
(MM)
Value
(MM$)
Portfolio % ΔPortfolio %
1.09 29.19 11.1264 11.1264
0.38 11.74 4.4756 4.4756
0.03 5.42 2.0658 2.0658
0.15 5.04 1.9208 1.9208
0.03 3.61 1.3758 1.3758
0.03 3.12 1.1900 1.1900
0.07 2.76 1.0524 1.0524
0.08 11.43 4.3566 0.6125
0.00 1.24 0.4727 0.4727
0.01 6.67 2.5405 0.4318
Top Decreases This Quarter

We use the change in the portfolio allocation because this is the most meaningful metric. Changes can be due to trades or changes in share prices.

Security Shares
(MM)
Value
(MM$)
Portfolio % ΔPortfolio %
0.59 15.45 5.8903 -6.8085
0.41 19.96 7.6088 -1.3769
0.59 27.44 10.4604 -1.2258
0.72 11.76 4.4832 -0.9277
0.06 6.55 2.4950 -0.7722
0.23 11.75 4.4798 -0.5774
0.04 6.33 2.4125 -0.5177
0.03 3.53 1.3436 -0.2804
0.53 8.22 3.1320 -0.2747
0.48 4.28 1.6297 -0.2333
13F and Fund Filings

This form was filed on 2025-07-31 for the reporting period 2025-06-30. Click the link icon to see the full transaction history.

Upgrade to unlock premium data and export to Excel .

2022-07-28: Important Note - We have changed the treatment of the Δ Portfolio % column in this table. Previously, we were reporting it as the percent change in the portfolio allocation. We are now reporting it as the raw change in the portfolio allocation (still reported as a percent). In formula terms, we were previously reporting it as 100 * (current allocation - prior allocation ) / prior allocation. We are now reporting it as (current allocation - prior allocation).
Security Type Avg Share Price Shares
(MM)
ΔShares
(%)
ΔShares
(%)
Value
($MM)
Portfolio
(%)
ΔPortfolio
(%)
CTA / Simplify Exchange Traded Funds - Simplify Managed Futures Strategy ETF 1.09 29.19 11.1264 11.1264
DBND / DoubleLine ETF Trust - DoubleLine Opportunistic Core Bond ETF 0.59 6.94 27.44 7.10 10.4604 -1.2258
HEDJ / WisdomTree Trust - WisdomTree Europe Hedged Equity Fund 0.41 -0.03 19.96 1.32 7.6088 -1.3769
SFLO / Victory Portfolios II - VictoryShares Small Cap Free Cash Flow ETF 0.59 -48.06 15.45 -44.50 5.8903 -6.8085
ASEA / Global X Funds - Global X FTSE Southeast Asia ETF 0.72 -4.75 11.76 -0.86 4.4832 -0.9277
JMST / J.P. Morgan Exchange-Traded Fund Trust - JPMorgan Ultra-Short Municipal Income ETF 0.23 5.85 11.75 6.00 4.4798 -0.5774
NDIA / Global X Funds - Global X India Active ETF 0.38 11.74 4.4756 4.4756
AMD / Advanced Micro Devices, Inc. 0.08 0.80 11.43 39.24 4.3566 0.6125
ULTA / Ulta Beauty, Inc. 0.02 -2.05 9.46 25.02 3.6070 0.1547
C / Citigroup Inc. 0.10 0.18 8.92 20.12 3.3995 0.0131
KGC / Kinross Gold Corporation 0.53 -11.25 8.22 10.01 3.1320 -0.2747
NOW / ServiceNow, Inc. 0.01 -0.06 7.93 29.05 3.0208 0.2199
PFE / Pfizer Inc. 0.32 17.04 7.87 11.97 2.9986 -0.2060
UBER / Uber Technologies, Inc. 0.08 0.42 7.52 28.58 2.8673 0.1992
META / Meta Platforms, Inc. 0.01 0.80 7.03 29.10 2.6784 0.1958
CRWD / CrowdStrike Holdings, Inc. 0.01 -0.21 6.67 44.17 2.5405 0.4318
BABA / Alibaba Group Holding Limited - Depositary Receipt (Common Stock) 0.06 6.54 6.55 -8.63 2.4950 -0.7722
CVX / Chevron Corporation 0.04 15.09 6.33 -1.49 2.4125 -0.5177
SHOP / Shopify Inc. 0.05 1.29 5.70 22.40 2.1744 0.0492
ABBV / AbbVie Inc. 0.03 5.42 2.0658 2.0658
SLB / Schlumberger Limited 0.15 5.04 1.9208 1.9208
BDJ / BlackRock Enhanced Equity Dividend Trust 0.48 1.25 4.28 4.65 1.6297 -0.2333
VRT / Vertiv Holdings Co 0.03 3.61 1.3758 1.3758
XOM / Exxon Mobil Corporation 0.03 9.22 3.53 -0.98 1.3436 -0.2804
SN / SharkNinja, Inc. 0.03 3.12 1.1900 1.1900
GFS / GLOBALFOUNDRIES Inc. 0.07 2.76 1.0524 1.0524
CSCO / Cisco Systems, Inc. 0.03 -1.42 1.88 10.86 0.7159 -0.0570
IBM / International Business Machines Corporation 0.01 -5.52 1.88 12.01 0.7150 -0.0488
BXP / Boston Properties, Inc. 0.03 1.26 1.70 1.68 0.6468 -0.1144
BRK.A / Berkshire Hathaway Inc. 0.00 0.00 1.46 -8.71 0.5556 -0.1727
XLK / The Select Sector SPDR Trust - The Technology Select Sector SPDR Fund 0.00 1.24 0.4727 0.4727
VZ / Verizon Communications Inc. 0.03 3.62 1.15 -1.20 0.4394 -0.0925
RSP / Invesco Exchange-Traded Fund Trust - Invesco S&P 500 Equal Weight ETF 0.01 -9.64 1.14 -5.24 0.4349 -0.1141
SPY / SPDR S&P 500 ETF 0.00 -1.39 0.74 8.96 0.2831 -0.0279
MFC / Manulife Financial Corporation 0.02 9.32 0.61 12.15 0.2324 -0.0155
IHE / iShares Trust - iShares U.S. Pharmaceuticals ETF 0.01 0.60 0.2295 0.2295
NEE / NextEra Energy, Inc. 0.01 0.55 0.2103 0.2103
SGOV / iShares Trust - iShares 0-3 Month Treasury Bond ETF 0.01 0.00 0.50 0.00 0.1919 -0.0377
SUSA / iShares Trust - iShares ESG Optimized MSCI USA ETF 0.00 0.23 0.0873 0.0873
DVN / Devon Energy Corporation 0.00 -100.00 0.00 0.0000
XBI / SPDR Series Trust - SPDR S&P Biotech ETF 0.00 -100.00 0.00 0.0000
CMCSA / Comcast Corporation 0.00 -100.00 0.00 0.0000
BAC / Bank of America Corporation 0.00 -100.00 0.00 0.0000
PGX / Invesco Exchange-Traded Fund Trust II - Invesco Preferred ETF 0.00 -100.00 0.00 0.0000