Basic Stats
| Portfolio Value | $ 195,878,633 |
| Current Positions | 33 |
Latest Holdings, Performance, AUM (from 13F, 13D)
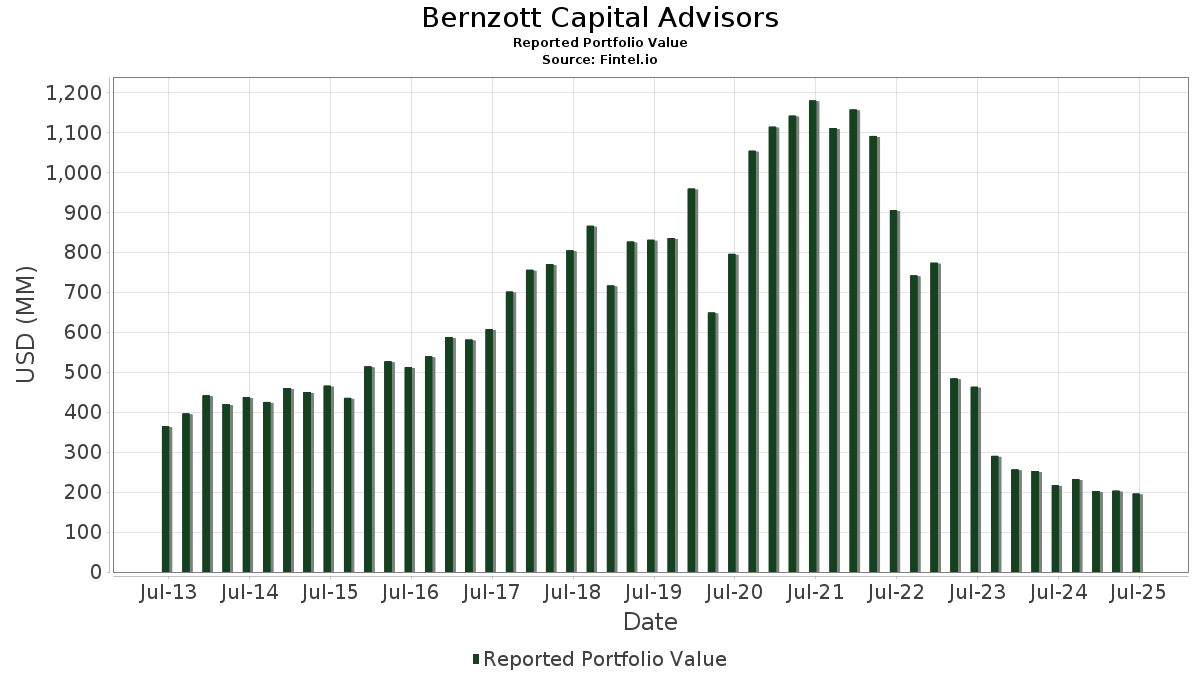
Bernzott Capital Advisors has disclosed 33 total holdings in their latest SEC filings. Most recent portfolio value is calculated to be $ 195,878,633 USD. Actual Assets Under Management (AUM) is this value plus cash (which is not disclosed). Bernzott Capital Advisors’s top holdings are MP Materials Corp. (US:MP) , NV5 Global, Inc. (US:NVEE) , Janus International Group, Inc. (US:JBI) , American Tower Corporation (US:AMT) , and J&J Snack Foods Corp. (US:JJSF) .
Top Increases This Quarter
We use the change in the portfolio allocation because this is the most meaningful metric. Changes can be due to trades or changes in share prices.
| Security | Shares (MM) |
Value (MM$) |
Portfolio % | ΔPortfolio % |
|---|---|---|---|---|
| 0.18 | 4.46 | 2.2770 | 2.0781 | |
| 0.11 | 4.22 | 2.1546 | 1.9441 | |
| 0.03 | 6.06 | 3.0936 | 1.0297 | |
| 0.40 | 9.24 | 4.7189 | 1.0036 | |
| 0.46 | 7.32 | 3.7382 | 0.7462 | |
| 0.23 | 7.22 | 3.6843 | 0.7090 | |
| 1.04 | 8.45 | 4.3155 | 0.6946 | |
| 0.03 | 5.68 | 2.9012 | 0.6646 | |
| 0.16 | 6.75 | 3.4467 | 0.5043 | |
| 0.06 | 5.64 | 2.8801 | 0.4943 |
Top Decreases This Quarter
We use the change in the portfolio allocation because this is the most meaningful metric. Changes can be due to trades or changes in share prices.
| Security | Shares (MM) |
Value (MM$) |
Portfolio % | ΔPortfolio % |
|---|---|---|---|---|
| 0.07 | 3.66 | 1.8697 | -1.3269 | |
| 0.04 | 5.73 | 2.9259 | -1.0280 | |
| 0.05 | 4.46 | 2.2771 | -0.8738 | |
| 0.10 | 5.82 | 2.9735 | -0.3700 | |
| 0.11 | 3.45 | 1.7624 | -0.3357 | |
| 0.10 | 6.43 | 3.2808 | -0.2895 | |
| 0.03 | 5.10 | 2.6047 | -0.2104 | |
| 0.43 | 6.54 | 3.3372 | -0.1605 | |
| 0.05 | 5.95 | 3.0389 | -0.1294 | |
| 0.19 | 7.35 | 3.7517 | -0.0148 |
13F and Fund Filings
This form was filed on 2025-07-30 for the reporting period 2025-06-30. Click the link icon to see the full transaction history.
Upgrade to unlock premium data and export to Excel ![]() .
.
| Security | Type | Avg Share Price | Shares (MM) |
ΔShares (%) |
ΔShares (%) |
Value ($MM) |
Portfolio (%) |
ΔPortfolio (%) |
|
|---|---|---|---|---|---|---|---|---|---|
| MP / MP Materials Corp. | 0.31 | -25.30 | 10.30 | 1.82 | 5.2593 | 0.2783 | |||
| NVEE / NV5 Global, Inc. | 0.40 | 2.21 | 9.24 | 22.47 | 4.7189 | 1.0036 | |||
| JBI / Janus International Group, Inc. | 1.04 | 1.66 | 8.45 | 14.93 | 4.3155 | 0.6946 | |||
| AMT / American Tower Corporation | 0.04 | -3.50 | 7.80 | -1.98 | 3.9845 | 0.0646 | |||
| JJSF / J&J Snack Foods Corp. | 0.07 | 22.33 | 7.53 | 5.33 | 3.8434 | 0.3247 | |||
| PCH / PotlatchDeltic Corporation | 0.19 | 12.95 | 7.35 | -3.96 | 3.7517 | -0.0148 | |||
| VSH / Vishay Intertechnology, Inc. | 0.46 | 20.63 | 7.32 | 20.49 | 3.7382 | 0.7462 | |||
| ENOV / Enovis Corporation | 0.23 | 45.49 | 7.22 | 19.41 | 3.6843 | 0.7090 | |||
| NNN / NNN REIT, Inc. | 0.16 | 11.57 | 6.75 | 12.95 | 3.4467 | 0.5043 | |||
| LANC / Lancaster Colony Corporation | 0.04 | -2.30 | 6.67 | -3.54 | 3.4067 | 0.0009 | |||
| CMCO / Columbus McKinnon Corporation | 0.43 | 2.00 | 6.54 | -8.01 | 3.3372 | -0.1605 | |||
| HHH / Howard Hughes Holdings Inc. | 0.10 | -2.75 | 6.43 | -11.39 | 3.2808 | -0.2895 | |||
| GDEN / Golden Entertainment, Inc. | 0.22 | -2.91 | 6.38 | 8.27 | 3.2556 | 0.3563 | |||
| HLMN / Hillman Solutions Corp. | 0.87 | 29.08 | 6.20 | 4.85 | 3.1656 | 0.2543 | |||
| ORCL / Oracle Corporation | 0.03 | -7.57 | 6.06 | 44.54 | 3.0936 | 1.0297 | |||
| LW / Lamb Weston Holdings, Inc. | 0.12 | 11.66 | 6.02 | 8.62 | 3.0751 | 0.3453 | |||
| EHC / Encompass Health Corporation | 0.05 | -23.61 | 5.95 | -7.51 | 3.0389 | -0.1294 | |||
| TRNO / Terreno Realty Corporation | 0.10 | -3.31 | 5.82 | -14.24 | 2.9735 | -0.3700 | |||
| HI / Hillenbrand, Inc. | 0.29 | 28.84 | 5.81 | 7.12 | 2.9647 | 0.2959 | |||
| SLGN / Silgan Holdings Inc. | 0.11 | -4.17 | 5.74 | 1.58 | 2.9285 | 0.1481 | |||
| HCI / HCI Group, Inc. | 0.04 | -30.04 | 5.73 | -28.64 | 2.9259 | -1.0280 | |||
| BDX / Becton, Dickinson and Company | 0.03 | 66.33 | 5.68 | 25.07 | 2.9012 | 0.6646 | |||
| GVA / Granite Construction Incorporated | 0.06 | -6.14 | 5.64 | 16.41 | 2.8801 | 0.4943 | |||
| KRG / Kite Realty Group Trust | 0.25 | 1.49 | 5.63 | 2.76 | 2.8732 | 0.1770 | |||
| JNJ / Johnson & Johnson | 0.03 | -3.13 | 5.10 | -10.77 | 2.6047 | -0.2104 | |||
| WSC / WillScot Holdings Corporation | 0.17 | 2.17 | 4.53 | 0.71 | 2.3133 | 0.0980 | |||
| NFG / National Fuel Gas Company | 0.05 | -34.86 | 4.46 | -30.31 | 2.2771 | -0.8738 | |||
| AROC / Archrock, Inc. | 0.18 | 1,066.78 | 4.46 | 1,006.70 | 2.2770 | 2.0781 | |||
| VNOM / Viper Energy, Inc. | 0.11 | 1,068.81 | 4.22 | 888.29 | 2.1546 | 1.9441 | |||
| HALO / Halozyme Therapeutics, Inc. | 0.07 | -30.81 | 3.66 | -43.60 | 1.8697 | -1.3269 | |||
| DVN / Devon Energy Corporation | 0.11 | -4.76 | 3.45 | -18.99 | 1.7624 | -0.3357 | |||
| VT / Vanguard International Equity Index Funds - Vanguard Total World Stock ETF | 0.02 | 2.03 | 3.16 | 13.09 | 1.6139 | 0.2379 | |||
| CHRD / Chord Energy Corporation | 0.01 | 47.46 | 0.56 | 26.65 | 0.2841 | 0.0679 | |||
| VOO / Vanguard Index Funds - Vanguard S&P 500 ETF | 0.00 | -100.00 | 0.00 | 0.0000 | |||||
| COOP / Mr. Cooper Group Inc. | 0.00 | -100.00 | 0.00 | 0.0000 | |||||
| APA / APA Corporation | 0.00 | -100.00 | 0.00 | 0.0000 | |||||
| PTEN / Patterson-UTI Energy, Inc. | 0.00 | -100.00 | 0.00 | 0.0000 | |||||
| ZBH / Zimmer Biomet Holdings, Inc. | 0.00 | -100.00 | 0.00 | 0.0000 |