Basic Stats
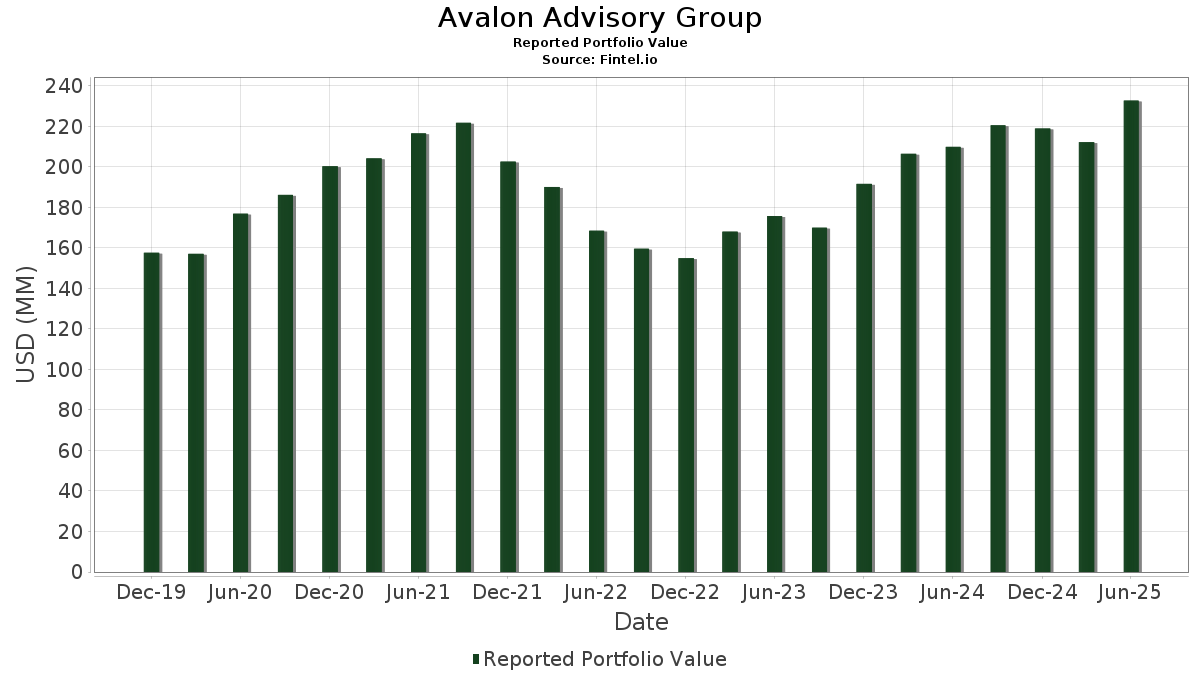
| Portfolio Value | $ 232,795,339 |
| Current Positions | 16 |
Latest Holdings, Performance, AUM (from 13F, 13D)
Avalon Advisory Group has disclosed 16 total holdings in their latest SEC filings. Most recent portfolio value is calculated to be $ 232,795,339 USD. Actual Assets Under Management (AUM) is this value plus cash (which is not disclosed). Avalon Advisory Group’s top holdings are Vanguard Index Funds - Vanguard Total Stock Market ETF (US:VTI) , iShares Trust - iShares 7-10 Year Treasury Bond ETF (US:IEF) , Vanguard International Equity Index Funds - Vanguard FTSE All-World ex-US ETF (US:VEU) , iShares Trust - iShares Core S&P Total U.S. Stock Market ETF (US:ITOT) , and Schwab Strategic Trust - Schwab International Equity ETF (US:SCHF) .
Top Increases This Quarter
We use the change in the portfolio allocation because this is the most meaningful metric. Changes can be due to trades or changes in share prices.
| Security | Shares (MM) |
Value (MM$) |
Portfolio % | ΔPortfolio % |
|---|---|---|---|---|
| 0.38 | 116.40 | 50.0016 | 0.9025 | |
| 0.20 | 13.67 | 5.8736 | 0.2060 | |
| 0.16 | 3.79 | 1.6279 | 0.2016 | |
| 0.06 | 7.90 | 3.3929 | 0.1516 | |
| 0.01 | 0.93 | 0.3991 | 0.0989 | |
| 0.00 | 0.23 | 0.0973 | 0.0973 | |
| 0.00 | 0.68 | 0.2904 | 0.0462 | |
| 0.18 | 3.93 | 1.6865 | 0.0311 | |
| 0.03 | 2.39 | 1.0273 | 0.0139 | |
| 0.00 | 0.78 | 0.3348 | 0.0026 |
Top Decreases This Quarter
We use the change in the portfolio allocation because this is the most meaningful metric. Changes can be due to trades or changes in share prices.
| Security | Shares (MM) |
Value (MM$) |
Portfolio % | ΔPortfolio % |
|---|---|---|---|---|
| 0.82 | 78.78 | 33.8406 | -1.5945 | |
| 0.01 | 1.15 | 0.4936 | -0.0839 | |
| 0.00 | 0.54 | 0.2316 | -0.0428 | |
| 0.03 | 1.04 | 0.4446 | -0.0201 | |
| 0.01 | 0.35 | 0.1513 | -0.0111 |
13F and Fund Filings
This form was filed on 2025-07-14 for the reporting period 2025-06-30. Click the link icon to see the full transaction history.
Upgrade to unlock premium data and export to Excel ![]() .
.