Basic Stats
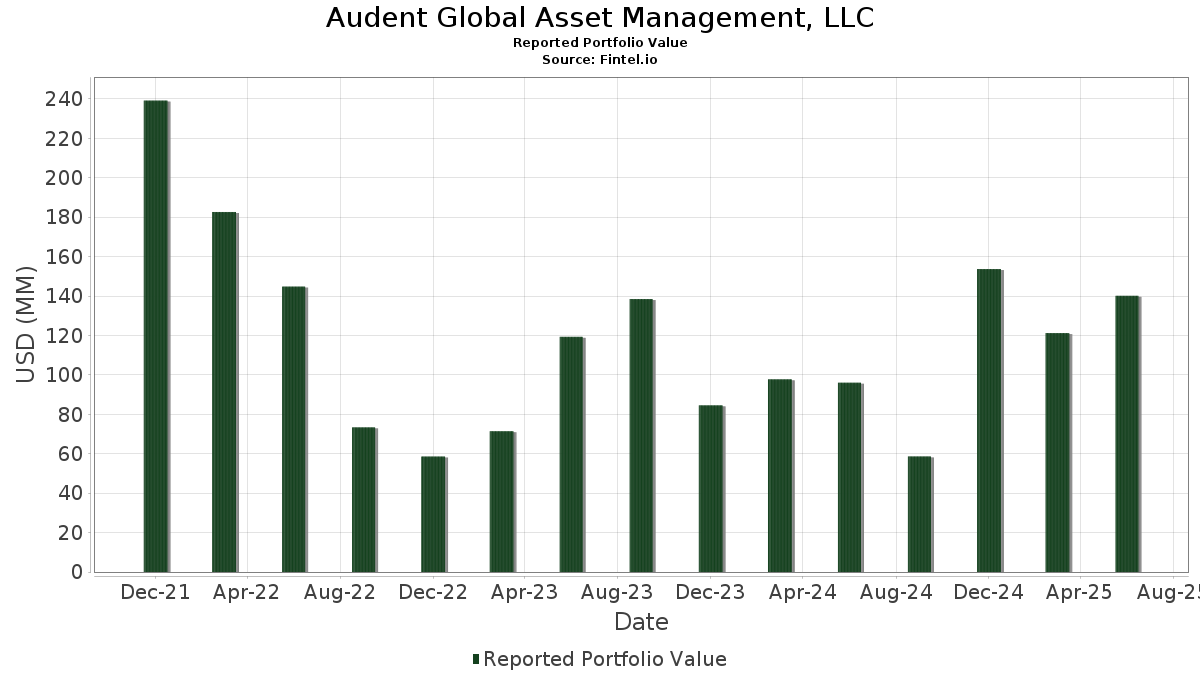
| Portfolio Value | $ 140,125,241 |
| Current Positions | 52 |
Latest Holdings, Performance, AUM (from 13F, 13D)
Audent Global Asset Management, LLC has disclosed 52 total holdings in their latest SEC filings. Most recent portfolio value is calculated to be $ 140,125,241 USD. Actual Assets Under Management (AUM) is this value plus cash (which is not disclosed). Audent Global Asset Management, LLC’s top holdings are Direxion Shares ETF Trust - Direxion Daily NVDA Bear 1X Shares (US:NVDD) , Alphabet Inc. (US:GOOGL) , Microsoft Corporation (US:MSFT) , Amazon.com, Inc. (US:AMZN) , and SPDR S&P 500 ETF (US:SPY) . Audent Global Asset Management, LLC’s new positions include Invesco S&P 500 Equal Weight Income Advantage ETF (US:RSPA) , Walmart Inc. (US:WMT) , APA Corporation (US:APA) , .
Top Increases This Quarter
We use the change in the portfolio allocation because this is the most meaningful metric. Changes can be due to trades or changes in share prices.
| Security | Shares (MM) |
Value (MM$) |
Portfolio % | ΔPortfolio % |
|---|---|---|---|---|
| 0.08 | 12.37 | 8.8286 | 1.8000 | |
| 0.01 | 1.65 | 1.1800 | 1.1800 | |
| 0.01 | 1.62 | 1.1582 | 1.1582 | |
| 0.01 | 7.08 | 5.0536 | 0.9230 | |
| 0.01 | 3.41 | 2.4352 | 0.6971 | |
| 0.01 | 7.43 | 5.3001 | 0.6448 | |
| 0.01 | 0.86 | 0.6111 | 0.6111 | |
| 0.03 | 4.67 | 3.3341 | 0.5471 | |
| 0.01 | 5.02 | 3.5826 | 0.3791 | |
| 0.01 | 0.70 | 0.5030 | 0.3068 |
Top Decreases This Quarter
We use the change in the portfolio allocation because this is the most meaningful metric. Changes can be due to trades or changes in share prices.
| Security | Shares (MM) |
Value (MM$) |
Portfolio % | ΔPortfolio % |
|---|---|---|---|---|
| 0.03 | 6.72 | 4.7954 | -1.2502 | |
| 0.00 | 0.41 | 0.2957 | -0.8656 | |
| 0.08 | 4.76 | 3.3975 | -0.8269 | |
| 0.03 | 5.75 | 4.1033 | -0.5067 | |
| 0.04 | 1.31 | 0.9357 | -0.4140 | |
| 0.03 | 3.24 | 2.3121 | -0.3841 | |
| 0.01 | 3.40 | 2.4296 | -0.3603 | |
| 0.02 | 1.60 | 1.1429 | -0.3109 | |
| 0.02 | 1.63 | 1.1606 | -0.2713 | |
| 0.01 | 1.54 | 1.1007 | -0.2654 |
13F and Fund Filings
This form was filed on 2025-08-15 for the reporting period 2025-06-30. Click the link icon to see the full transaction history.
Upgrade to unlock premium data and export to Excel ![]() .
.
| Security | Type | Avg Share Price | Shares (MM) |
ΔShares (%) |
ΔShares (%) |
Value ($MM) |
Portfolio (%) |
ΔPortfolio (%) |
|
|---|---|---|---|---|---|---|---|---|---|
| NVDD / Direxion Shares ETF Trust - Direxion Daily NVDA Bear 1X Shares | 0.08 | -0.39 | 12.37 | 45.22 | 8.8286 | 1.8000 | |||
| GOOGL / Alphabet Inc. | 0.04 | -0.18 | 7.43 | 13.74 | 5.3043 | -0.0863 | |||
| MSFT / Microsoft Corporation | 0.01 | -0.67 | 7.43 | 31.62 | 5.3001 | 0.6448 | |||
| AMZN / Amazon.com, Inc. | 0.03 | -0.39 | 7.41 | 14.86 | 5.2859 | -0.0343 | |||
| SPY / SPDR S&P 500 ETF | 0.01 | 1.76 | 7.16 | 12.71 | 5.1088 | -0.1310 | |||
| NFLX / Netflix, Inc. | 0.01 | -1.51 | 7.08 | 41.45 | 5.0536 | 0.9230 | |||
| AAPL / Apple Inc. | 0.03 | -0.72 | 6.72 | -8.31 | 4.7954 | -1.2502 | |||
| MTUM / iShares Trust - iShares MSCI USA Momentum Factor ETF | 0.03 | 0.38 | 6.70 | 19.35 | 4.7808 | 0.1499 | |||
| IWM / iShares Trust - iShares Russell 2000 ETF | 0.03 | -4.88 | 5.75 | 2.90 | 4.1033 | -0.5067 | |||
| GS / The Goldman Sachs Group, Inc. | 0.01 | -0.21 | 5.02 | 29.28 | 3.5826 | 0.3791 | |||
| IYH / iShares Trust - iShares U.S. Healthcare ETF | 0.08 | 0.23 | 4.76 | -7.03 | 3.3975 | -0.8269 | |||
| AMD / Advanced Micro Devices, Inc. | 0.03 | 0.13 | 4.67 | 38.28 | 3.3341 | 0.5471 | |||
| META / Meta Platforms, Inc. | 0.01 | -1.83 | 3.73 | 25.75 | 2.6627 | 0.2143 | |||
| LULU / lululemon athletica inc. | 0.01 | 92.97 | 3.41 | 62.01 | 2.4352 | 0.6971 | |||
| MDY / SPDR S&P MidCap 400 ETF Trust | 0.01 | -5.44 | 3.40 | 0.68 | 2.4296 | -0.3603 | |||
| IBB / iShares Trust - iShares Biotechnology ETF | 0.03 | 0.22 | 3.24 | -0.89 | 2.3121 | -0.3841 | |||
| JPM / JPMorgan Chase & Co. | 0.01 | -0.48 | 3.24 | 17.64 | 2.3087 | 0.0395 | |||
| EFA / iShares Trust - iShares MSCI EAFE ETF | 0.04 | 0.00 | 3.19 | 9.40 | 2.2751 | -0.1296 | |||
| PYPL / PayPal Holdings, Inc. | 0.04 | 0.00 | 2.70 | 13.89 | 1.9251 | -0.0288 | |||
| NKE / NIKE, Inc. | 0.04 | -0.54 | 2.50 | 11.94 | 1.7868 | -0.0587 | |||
| AMAT / Applied Materials, Inc. | 0.01 | -0.27 | 2.42 | 25.83 | 1.7243 | 0.1399 | |||
| ADBE / Adobe Inc. | 0.01 | -0.47 | 2.05 | 0.39 | 1.4650 | -0.2218 | |||
| ACN / Accenture plc | 0.01 | 0.00 | 1.79 | -4.22 | 1.2798 | -0.2648 | |||
| UNH / UnitedHealth Group Incorporated | 0.01 | 1.65 | 1.1800 | 1.1800 | |||||
| IEO / iShares Trust - iShares U.S. Oil & Gas Exploration & Production ETF | 0.02 | 0.03 | 1.63 | -6.28 | 1.1606 | -0.2713 | |||
| RSPA / Invesco S&P 500 Equal Weight Income Advantage ETF | 0.01 | 1.62 | 1.1582 | 1.1582 | |||||
| XLE / The Select Sector SPDR Trust - The Energy Select Sector SPDR Fund | 0.02 | 0.14 | 1.60 | -9.14 | 1.1429 | -0.3109 | |||
| MCD / McDonald's Corporation | 0.01 | -0.42 | 1.54 | -6.83 | 1.1007 | -0.2654 | |||
| EEM / iShares, Inc. - iShares MSCI Emerging Markets ETF | 0.03 | 0.00 | 1.51 | 10.34 | 1.0745 | -0.0507 | |||
| EOG / EOG Resources, Inc. | 0.01 | -0.63 | 1.44 | -7.33 | 1.0294 | -0.2545 | |||
| SLB / Schlumberger Limited | 0.04 | -1.59 | 1.31 | -19.87 | 0.9357 | -0.4140 | |||
| XLF / The Select Sector SPDR Trust - The Financial Select Sector SPDR Fund | 0.02 | 0.47 | 1.30 | 5.62 | 0.9262 | -0.0874 | |||
| V / Visa Inc. | 0.00 | -0.64 | 1.15 | 0.61 | 0.8240 | -0.1223 | |||
| CAT / Caterpillar Inc. | 0.00 | -0.44 | 1.06 | 17.24 | 0.7577 | 0.0103 | |||
| XYZ / Block, Inc. | 0.01 | -0.38 | 0.95 | 24.58 | 0.6805 | 0.0489 | |||
| ICF / iShares Trust - iShares Select U.S. REIT ETF | 0.02 | 0.92 | 0.94 | 0.32 | 0.6683 | -0.1019 | |||
| DIS / The Walt Disney Company | 0.01 | -25.91 | 0.92 | -6.59 | 0.6587 | -0.1562 | |||
| OIH / VanEck ETF Trust - VanEck Oil Services ETF | 0.00 | 0.36 | 0.91 | -11.83 | 0.6490 | -0.2019 | |||
| WMT / Walmart Inc. | 0.01 | 0.86 | 0.6111 | 0.6111 | |||||
| C / Citigroup Inc. | 0.01 | 147.19 | 0.70 | 197.05 | 0.5030 | 0.3068 | |||
| UBER / Uber Technologies, Inc. | 0.01 | -0.76 | 0.70 | 27.24 | 0.4968 | 0.0449 | |||
| MA / Mastercard Incorporated | 0.00 | -1.29 | 0.69 | 1.18 | 0.4901 | -0.0698 | |||
| ROKU / Roku, Inc. | 0.01 | 1.05 | 0.52 | 26.23 | 0.3676 | 0.0306 | |||
| TSLA / Tesla, Inc. | 0.00 | 20.71 | 0.51 | 48.09 | 0.3607 | 0.0789 | |||
| SBUX / Starbucks Corporation | 0.01 | -1.32 | 0.46 | -7.85 | 0.3273 | -0.0832 | |||
| XOM / Exxon Mobil Corporation | 0.00 | -67.52 | 0.41 | -70.58 | 0.2957 | -0.8656 | |||
| IYR / iShares Trust - iShares U.S. Real Estate ETF | 0.00 | 1.09 | 0.41 | 0.00 | 0.2943 | -0.0457 | |||
| DOCU / DocuSign, Inc. | 0.01 | -3.86 | 0.40 | -8.03 | 0.2863 | -0.0735 | |||
| BA / The Boeing Company | 0.00 | 1.85 | 0.36 | 24.91 | 0.2547 | 0.0194 | |||
| APA / APA Corporation | 0.02 | 0.35 | 0.2480 | 0.2480 | |||||
| ATAI / Atai Life Sciences N.V. | 0.02 | 0.00 | 0.04 | 63.64 | 0.0263 | 0.0074 | |||
| UP / Wheels Up Experience Inc. | 0.02 | 0.00 | 0.02 | 6.25 | 0.0124 | -0.0011 | |||
| RBA / RB Global, Inc. | 0.00 | -100.00 | 0.00 | 0.0000 | |||||
| RSP / Invesco Exchange-Traded Fund Trust - Invesco S&P 500 Equal Weight ETF | 0.00 | -100.00 | 0.00 | 0.0000 |