Basic Stats
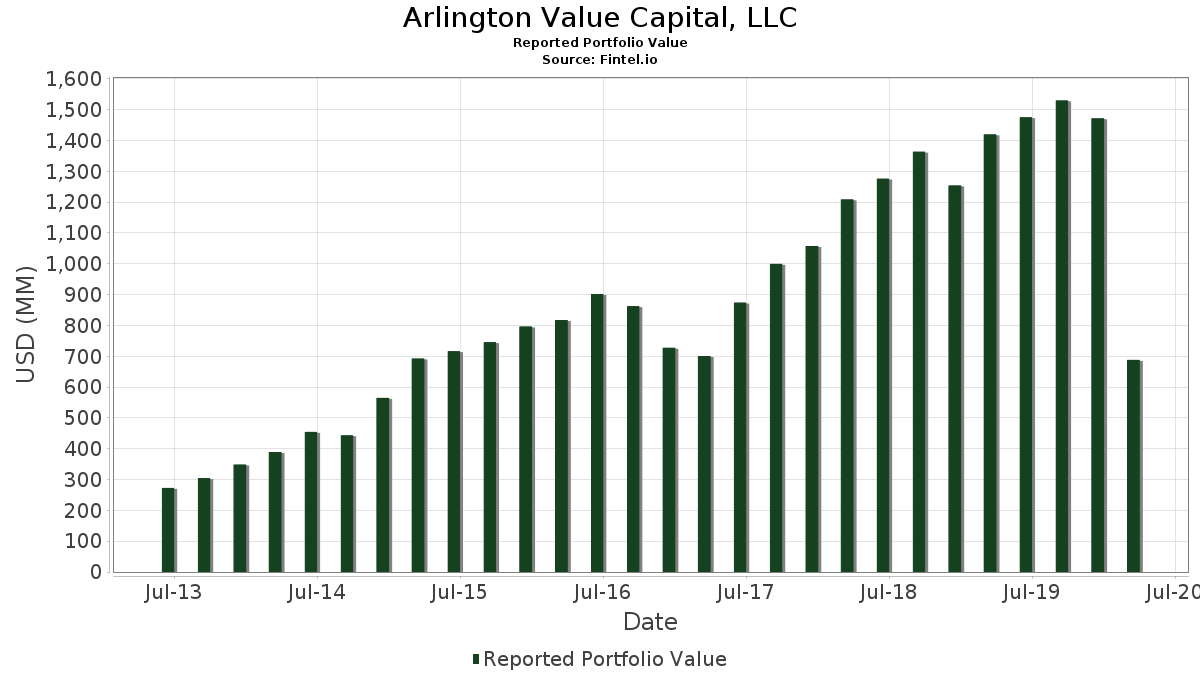
| Portfolio Value | $ 688,038,000 |
| Current Positions | 16 |
Latest Holdings, Performance, AUM (from 13F, 13D)
Arlington Value Capital, LLC has disclosed 16 total holdings in their latest SEC filings. Most recent portfolio value is calculated to be $ 688,038,000 USD. Actual Assets Under Management (AUM) is this value plus cash (which is not disclosed). Arlington Value Capital, LLC’s top holdings are Berkshire Hathaway Inc. (US:BRK.B) , Cimpress plc (US:CMPR) , AutoNation, Inc. (US:AN) , Spectrum Brands Holdings, Inc. (US:SPB) , and Monro, Inc. (US:MNRO) . Arlington Value Capital, LLC’s new positions include Wayfair Inc. (US:W) , .
Top Increases This Quarter
We use the change in the portfolio allocation because this is the most meaningful metric. Changes can be due to trades or changes in share prices.
| Security | Shares (MM) |
Value (MM$) |
Portfolio % | ΔPortfolio % |
|---|---|---|---|---|
| 1.44 | 263.23 | 38.2578 | 8.1496 | |
| 1.00 | 43.13 | 6.2693 | 2.5470 | |
| 0.23 | 12.39 | 1.8003 | 1.8003 | |
| 1.41 | 61.70 | 8.9669 | 0.8491 | |
| 0.00 | 11.70 | 1.6999 | 0.7076 | |
| 2.31 | 64.83 | 9.4227 | 0.5366 | |
| 3.06 | 41.78 | 6.0718 | 0.2765 | |
| 0.12 | 6.92 | 1.0050 | 0.0817 | |
| 0.01 | 0.48 | 0.0702 | 0.0702 | |
| 0.99 | 8.07 | 1.1730 | 0.0222 |
Top Decreases This Quarter
We use the change in the portfolio allocation because this is the most meaningful metric. Changes can be due to trades or changes in share prices.
| Security | Shares (MM) |
Value (MM$) |
Portfolio % | ΔPortfolio % |
|---|---|---|---|---|
| 0.71 | 23.74 | 3.4508 | -6.0657 | |
| 1.60 | 85.26 | 12.3918 | -4.6624 | |
| 1.75 | 63.64 | 9.2498 | -2.6317 | |
| 0.04 | 0.52 | 0.0760 | -1.1612 | |
| 0.03 | 0.60 | 0.0873 | -0.5090 | |
| 0.00 | 0.00 | -0.0140 |
13F and Fund Filings
This form was filed on 2020-05-15 for the reporting period 2020-03-31. Click the link icon to see the full transaction history.
Upgrade to unlock premium data and export to Excel ![]() .
.
| Security | Type | Avg Share Price | Shares (MM) |
ΔShares (%) |
ΔShares (%) |
Value ($MM) |
Portfolio (%) |
ΔPortfolio (%) |
|
|---|---|---|---|---|---|---|---|---|---|
| BRK.B / Berkshire Hathaway Inc. | 1.44 | -26.40 | 263.23 | -40.59 | 38.2578 | 8.1496 | |||
| CMPR / Cimpress plc | 1.60 | -19.69 | 85.26 | -66.03 | 12.3918 | -4.6624 | |||
| AN / AutoNation, Inc. | 2.31 | -14.08 | 64.83 | -50.42 | 9.4227 | 0.5366 | |||
| SPB / Spectrum Brands Holdings, Inc. | 1.75 | -35.66 | 63.64 | -63.60 | 9.2498 | -2.6317 | |||
| MNRO / Monro, Inc. | 1.41 | -7.81 | 61.70 | -48.35 | 8.9669 | 0.8491 | |||
| IBKR / Interactive Brokers Group, Inc. | 1.00 | -14.96 | 43.13 | -21.25 | 6.2693 | 2.5470 | |||
| JEF / Jefferies Financial Group Inc. | 3.06 | -23.42 | 41.78 | -51.01 | 6.0718 | 0.2765 | |||
| ADS / Bread Financial Holdings Inc | 0.71 | -43.47 | 23.74 | -83.05 | 3.4508 | -6.0657 | |||
| W / Wayfair Inc. | 0.23 | 12.39 | 1.8003 | 1.8003 | |||||
| BRK.A / Berkshire Hathaway Inc. | 0.00 | 0.00 | 11.70 | -19.90 | 1.6999 | 0.7076 | |||
| CVET / Covetrus Inc | 0.99 | -22.72 | 8.07 | -52.34 | 1.1730 | 0.0222 | |||
| US36164V3050 / GCI Liberty, Inc. | 0.12 | -36.71 | 6.92 | -49.11 | 1.0050 | 0.0817 | |||
| BAC / Bank of America Corporation | 0.03 | -88.63 | 0.60 | -93.15 | 0.0873 | -0.5090 | |||
| SAVE / Spirit Airlines, Inc. | 0.04 | -91.02 | 0.52 | -97.13 | 0.0760 | -1.1612 | |||
| TAP / Molson Coors Beverage Company | 0.01 | 0.48 | 0.0702 | 0.0702 | |||||
| DSWL / Deswell Industries, Inc. | 0.02 | 0.00 | 0.05 | -18.03 | 0.0073 | 0.0031 | |||
| GRUB / Just Eat Takeaway.com N.V. - ADR (New) | 0.00 | -100.00 | 0.00 | -100.00 | -0.0140 |