Basic Stats
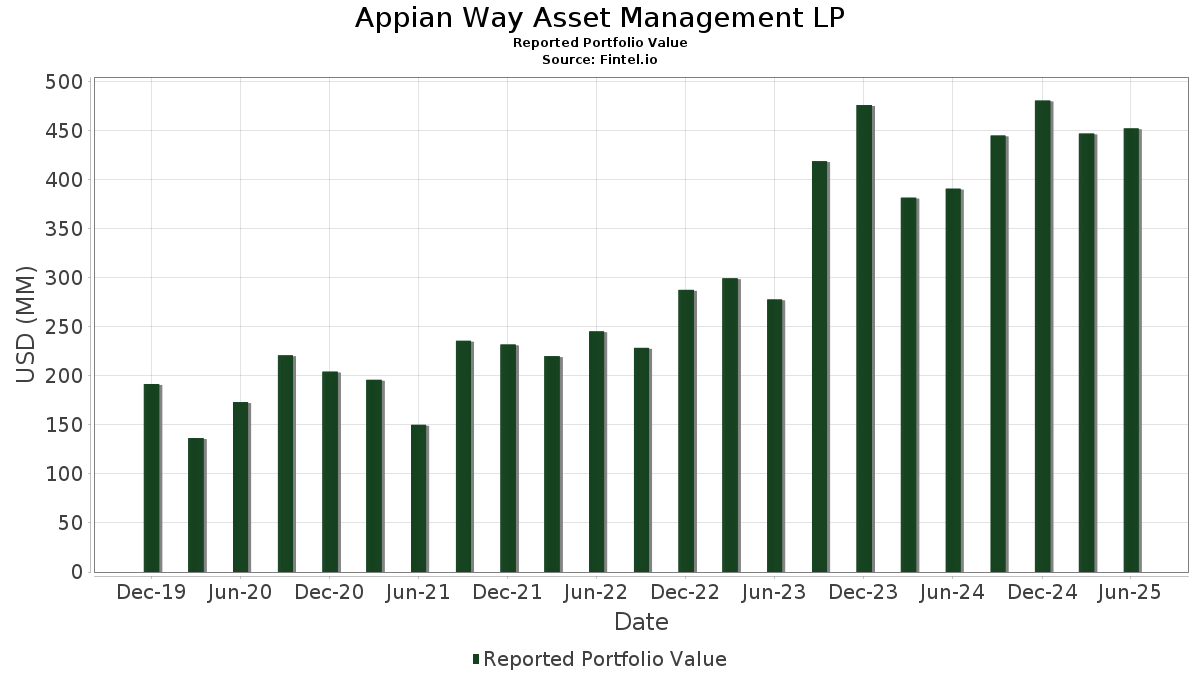
| Portfolio Value | $ 451,936,647 |
| Current Positions | 28 |
Latest Holdings, Performance, AUM (from 13F, 13D)
Appian Way Asset Management LP has disclosed 28 total holdings in their latest SEC filings. Most recent portfolio value is calculated to be $ 451,936,647 USD. Actual Assets Under Management (AUM) is this value plus cash (which is not disclosed). Appian Way Asset Management LP’s top holdings are PureCycle Technologies, Inc. (US:PCT) , Golar LNG Limited (US:GLNG) , FTAI Aviation Ltd. (US:FTAI) , The Chemours Company (US:CC) , and Amcor plc (US:AMCR) . Appian Way Asset Management LP’s new positions include Darling Ingredients Inc. (US:DAR) , CF Industries Holdings, Inc. (US:CF) , The Mosaic Company (US:MOS) , GXO Logistics, Inc. (US:GXO) , and IAMGOLD Corporation (US:IAG) .
Top Increases This Quarter
We use the change in the portfolio allocation because this is the most meaningful metric. Changes can be due to trades or changes in share prices.
| Security | Shares (MM) |
Value (MM$) |
Portfolio % | ΔPortfolio % |
|---|---|---|---|---|
| 0.73 | 27.70 | 6.1283 | 6.1283 | |
| 3.78 | 34.74 | 7.6877 | 5.6600 | |
| 1.50 | 33.96 | 7.5153 | 3.9822 | |
| 0.16 | 17.58 | 3.8899 | 3.8899 | |
| 3.81 | 43.66 | 9.6613 | 2.1756 | |
| 0.09 | 8.28 | 1.8321 | 1.8321 | |
| 0.23 | 8.21 | 1.8162 | 1.8162 | |
| 0.13 | 6.25 | 1.3823 | 1.3823 | |
| 0.50 | 8.49 | 1.8781 | 1.0039 | |
| 0.50 | 3.67 | 0.8130 | 0.8130 |
Top Decreases This Quarter
We use the change in the portfolio allocation because this is the most meaningful metric. Changes can be due to trades or changes in share prices.
| Security | Shares (MM) |
Value (MM$) |
Portfolio % | ΔPortfolio % |
|---|---|---|---|---|
| 5.36 | 24.12 | 5.3361 | -6.2193 | |
| 0.03 | 6.95 | 1.5377 | -4.9316 | |
| 0.70 | 21.82 | 4.8272 | -4.7985 | |
| 0.26 | 6.19 | 1.3702 | -2.5853 | |
| 1.21 | 49.93 | 11.0482 | -1.9187 | |
| 0.40 | 5.48 | 1.2126 | -0.6465 | |
| 0.42 | 47.75 | 10.5650 | -0.6399 | |
| 0.09 | 4.04 | 0.8937 | -0.3221 | |
| 0.35 | 4.01 | 0.8867 | -0.1734 | |
| 0.00 | 0.00 | -0.0114 |
13F and Fund Filings
This form was filed on 2025-08-14 for the reporting period 2025-06-30. Click the link icon to see the full transaction history.
Upgrade to unlock premium data and export to Excel ![]() .
.
| Security | Type | Avg Share Price | Shares (MM) |
ΔShares (%) |
ΔShares (%) |
Value ($MM) |
Portfolio (%) |
ΔPortfolio (%) |
|
|---|---|---|---|---|---|---|---|---|---|
| PCT / PureCycle Technologies, Inc. | 3.86 | -47.55 | 52.83 | 3.84 | 11.6890 | 0.3002 | |||
| GLNG / Golar LNG Limited | 1.21 | -20.49 | 49.93 | -13.79 | 11.0482 | -1.9187 | |||
| FTAI / FTAI Aviation Ltd. | 0.42 | -7.93 | 47.75 | -4.60 | 10.5650 | -0.6399 | |||
| CC / The Chemours Company | 3.81 | 54.31 | 43.66 | 30.58 | 9.6613 | 2.1756 | |||
| AMCR / Amcor plc | 3.78 | 304.89 | 34.74 | 283.60 | 7.6877 | 5.6600 | |||
| ESI / Element Solutions Inc | 1.50 | 114.84 | 33.96 | 115.22 | 7.5153 | 3.9822 | |||
| DAR / Darling Ingredients Inc. | Call | 0.73 | 27.70 | 6.1283 | 6.1283 | ||||
| SGML / Sigma Lithium Corporation | 5.36 | 7.98 | 24.12 | -53.28 | 5.3361 | -6.2193 | |||
| SEE / Sealed Air Corporation | 0.70 | -52.74 | 21.82 | -49.26 | 4.8272 | -4.7985 | |||
| KEX / Kirby Corporation | 0.16 | 17.58 | 3.8899 | 3.8899 | |||||
| TH / Target Hospitality Corp. | 1.89 | 4.93 | 13.48 | 13.55 | 2.9825 | 0.3248 | |||
| CORZ / Core Scientific, Inc. | 0.50 | -7.81 | 8.49 | 117.34 | 1.8781 | 1.0039 | |||
| CF / CF Industries Holdings, Inc. | Call | 0.09 | 8.28 | 1.8321 | 1.8321 | ||||
| MOS / The Mosaic Company | Call | 0.23 | 8.21 | 1.8162 | 1.8162 | ||||
| DY / Dycom Industries, Inc. | 0.03 | -85.01 | 6.95 | -75.95 | 1.5377 | -4.9316 | |||
| KNX / Knight-Swift Transportation Holdings Inc. | 0.15 | 102.11 | 6.50 | 105.53 | 1.4382 | 0.7303 | |||
| GXO / GXO Logistics, Inc. | 0.13 | 6.25 | 1.3823 | 1.3823 | |||||
| GEO / The GEO Group, Inc. | 0.26 | -57.25 | 6.19 | -64.95 | 1.3702 | -2.5853 | |||
| PCT / PureCycle Technologies, Inc. | Call | 0.40 | -66.67 | 5.48 | -34.01 | 1.2126 | -0.6465 | ||
| MTZ / MasTec, Inc. | 0.03 | 15.01 | 5.48 | 67.93 | 1.2123 | 0.4820 | |||
| FCX / Freeport-McMoRan Inc. | 0.09 | -35.05 | 4.04 | -25.64 | 0.8937 | -0.3221 | |||
| CC / The Chemours Company | Call | 0.35 | 0.00 | 4.01 | -15.37 | 0.8867 | -0.1734 | ||
| IAG / IAMGOLD Corporation | 0.50 | 3.67 | 0.8130 | 0.8130 | |||||
| CSL / Carlisle Companies Incorporated | 0.01 | 3.19 | 0.7063 | 0.7063 | |||||
| DAR / Darling Ingredients Inc. | 0.07 | 2.50 | 0.5524 | 0.5524 | |||||
| KTOS / Kratos Defense & Security Solutions, Inc. | 0.05 | 2.29 | 0.5062 | 0.5062 | |||||
| JBT / JBT Marel Corporation | 0.02 | 2.00 | 0.4417 | 0.4417 | |||||
| DRIO / DarioHealth Corp. | 1.28 | 0.00 | 0.86 | 9.44 | 0.1899 | 0.0143 | |||
| GEV / GE Vernova Inc. | 0.00 | -100.00 | 0.00 | 0.0000 | |||||
| PKG / Packaging Corporation of America | 0.00 | -100.00 | 0.00 | 0.0000 | |||||
| NXE / NexGen Energy Ltd. | 0.00 | -100.00 | 0.00 | -100.00 | -0.0114 | ||||
| AVNT / Avient Corporation | 0.00 | -100.00 | 0.00 | 0.0000 | |||||
| PSN / Parsons Corporation | 0.00 | -100.00 | 0.00 | 0.0000 | |||||
| WWD / Woodward, Inc. | 0.00 | -100.00 | 0.00 | 0.0000 | |||||
| BA / The Boeing Company | 0.00 | -100.00 | 0.00 | 0.0000 | |||||
| IWM / iShares Trust - iShares Russell 2000 ETF | Call | 0.00 | -100.00 | 0.00 | 0.0000 | ||||
| WLK / Westlake Corporation | 0.00 | -100.00 | 0.00 | 0.0000 | |||||
| WFG / West Fraser Timber Co. Ltd. | 0.00 | -100.00 | 0.00 | 0.0000 | |||||
| ATI / ATI Inc. | 0.00 | -100.00 | 0.00 | 0.0000 |