Basic Stats
Portfolio Value $ 3,671,828
Current Positions 28
Latest Holdings, Performance, AUM (from 13F, 13D)

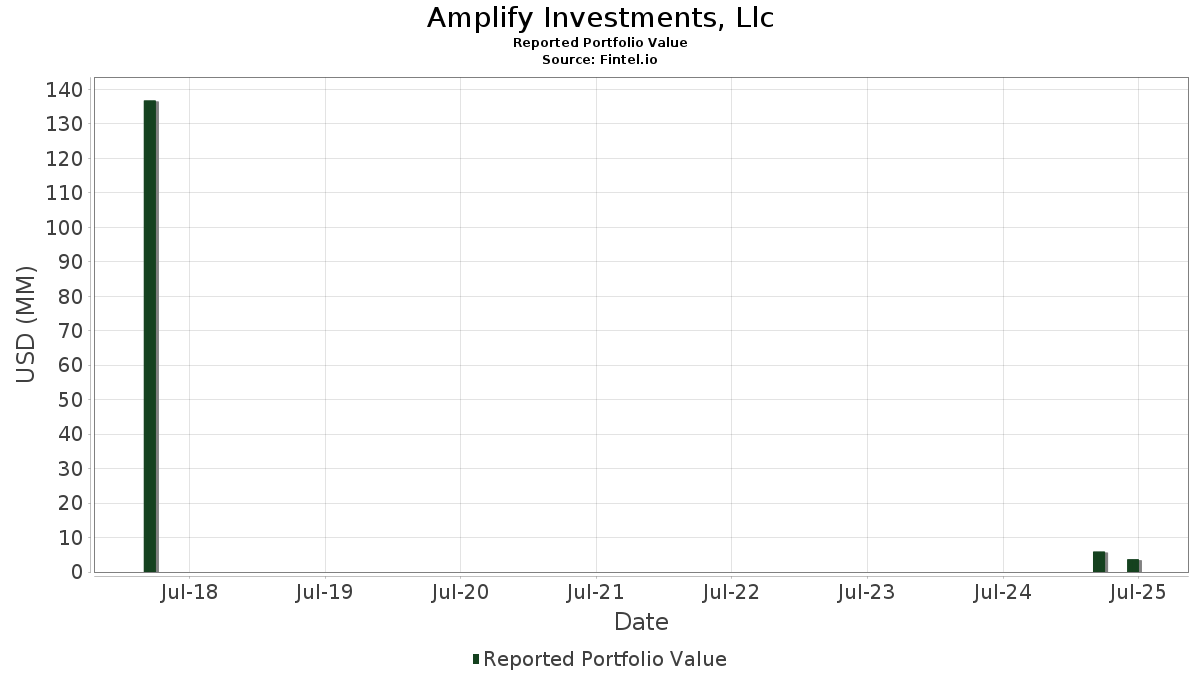
Amplify Investments, Llc has disclosed 28 total holdings in their latest SEC filings. Most recent portfolio value is calculated to be $ 3,671,828 USD. Actual Assets Under Management (AUM) is this value plus cash (which is not disclosed). Amplify Investments, Llc’s top holdings are The Williams Companies, Inc. (US:WMB) , Kinder Morgan, Inc. (US:KMI) , MPLX LP - Limited Partnership (US:MPLX) , Enbridge Inc. (US:ENB) , and TC Energy Corporation (CA:TRP) . Amplify Investments, Llc’s new positions include The Williams Companies, Inc. (US:WMB) , Kinder Morgan, Inc. (US:KMI) , MPLX LP - Limited Partnership (US:MPLX) , Enbridge Inc. (US:ENB) , and TC Energy Corporation (CA:TRP) .

Amplify Investments, Llc - Portfolio Value
Top Increases This Quarter

We use the change in the portfolio allocation because this is the most meaningful metric. Changes can be due to trades or changes in share prices.

Security Shares
(MM)
Value
(MM$)
Portfolio % ΔPortfolio %
0.01 0.34 9.1482 9.1482
0.01 0.33 8.9677 8.9677
0.01 0.31 8.4647 8.4647
0.01 0.28 7.6895 7.6895
0.00 0.20 5.5808 5.5808
0.01 0.18 4.9941 4.9941
0.00 0.18 4.9510 4.9510
0.00 0.15 4.1907 4.1907
0.01 0.15 4.0227 4.0227
0.01 0.14 3.8434 3.8434
Top Decreases This Quarter

We use the change in the portfolio allocation because this is the most meaningful metric. Changes can be due to trades or changes in share prices.

Security Shares
(MM)
Value
(MM$)
Portfolio % ΔPortfolio %
13F and Fund Filings

This form was filed on 2025-08-14 for the reporting period 2025-06-30. Click the link icon to see the full transaction history.

Upgrade to unlock premium data and export to Excel .

2022-07-28: Important Note - We have changed the treatment of the Δ Portfolio % column in this table. Previously, we were reporting it as the percent change in the portfolio allocation. We are now reporting it as the raw change in the portfolio allocation (still reported as a percent). In formula terms, we were previously reporting it as 100 * (current allocation - prior allocation ) / prior allocation. We are now reporting it as (current allocation - prior allocation).
Security Type Avg Share Price Shares
(MM)
ΔShares
(%)
ΔShares
(%)
Value
($MM)
Portfolio
(%)
ΔPortfolio
(%)
WMB / The Williams Companies, Inc. 0.01 0.34 9.1482 9.1482
KMI / Kinder Morgan, Inc. 0.01 0.33 8.9677 8.9677
MPLX / MPLX LP - Limited Partnership 0.01 0.31 8.4647 8.4647
ENB / Enbridge Inc. 0.01 0.28 7.6895 7.6895
TRP / TC Energy Corporation 0.00 0.20 5.5808 5.5808
SEI / Solaris Energy Infrastructure, Inc. 0.01 0.18 4.9941 4.9941
VST / Vistra Corp. 0.00 0.18 4.9510 4.9510
DTM / DT Midstream, Inc. 0.00 0.15 4.1907 4.1907
PAGP / Plains GP Holdings, L.P. - Limited Partnership 0.01 0.15 4.0227 4.0227
ET / Energy Transfer LP - Limited Partnership 0.01 0.14 3.8434 3.8434
AROC / Archrock, Inc. 0.01 0.14 3.8058 3.8058
WES / Western Midstream Partners, LP - Limited Partnership 0.00 0.14 3.7184 3.7184
TRGP / Targa Resources Corp. 0.00 0.12 3.2523 3.2523
GTLS / Chart Industries, Inc. 0.00 0.12 3.1389 3.1389
LNG / Cheniere Energy, Inc. 0.00 0.11 2.8783 2.8783
PPL / PPL Corporation 0.00 0.09 2.4939 2.4939
GLNG / Golar LNG Limited 0.00 0.09 2.4814 2.4814
EXE / Expand Energy Corporation 0.00 0.09 2.4077 2.4077
VG / Venture Global, Inc. 0.01 0.08 2.2752 2.2752
WOR / Worthington Enterprises, Inc. 0.00 0.07 2.0140 2.0140
APD / Air Products and Chemicals, Inc. 0.00 0.07 1.9358 1.9358
KGS / Kodiak Gas Services, Inc. 0.00 0.07 1.8293 1.8293
FLNG / FLEX LNG Ltd. 0.00 0.06 1.6845 1.6845
US8252528851 / Invesco Government & Agency Portfolio, Institutional Class 0.05 0.05 1.3938 1.3938
BE / Bloom Energy Corporation 0.00 0.04 1.1309 1.1309
OKE / ONEOK, Inc. 0.00 0.04 0.9960 0.9960
FANG / Diamondback Energy, Inc. 0.00 0.01 0.3667 0.3667
NEE / NextEra Energy, Inc. 0.00 0.01 0.3441 0.3441
TLT / iShares Trust - iShares 20+ Year Treasury Bond ETF 0.00 -100.00 0.00 0.0000