Basic Stats
| Portfolio Value | $ 1,749,660,564 |
| Current Positions | 85 |
Latest Holdings, Performance, AUM (from 13F, 13D)
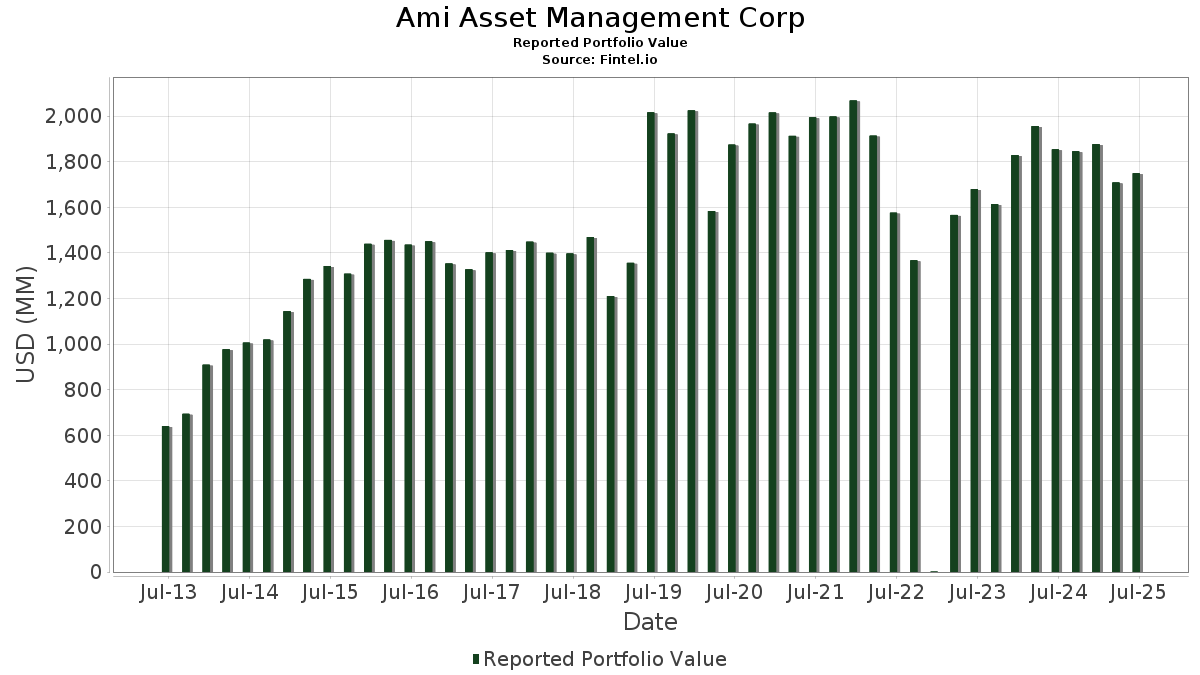
Ami Asset Management Corp has disclosed 85 total holdings in their latest SEC filings. Most recent portfolio value is calculated to be $ 1,749,660,564 USD. Actual Assets Under Management (AUM) is this value plus cash (which is not disclosed). Ami Asset Management Corp’s top holdings are Microsoft Corporation (US:MSFT) , Netflix, Inc. (US:NFLX) , Apple Inc. (US:AAPL) , Alphabet Inc. (US:GOOGL) , and Amazon.com, Inc. (US:AMZN) . Ami Asset Management Corp’s new positions include Scholar Rock Holding Corporation (US:SRRK) , CG Oncology, Inc. (US:CGON) , Corning Incorporated (US:GLW) , Palantir Technologies Inc. (US:PLTR) , and Commvault Systems, Inc. (US:CVLT) .
Top Increases This Quarter
We use the change in the portfolio allocation because this is the most meaningful metric. Changes can be due to trades or changes in share prices.
| Security | Shares (MM) |
Value (MM$) |
Portfolio % | ΔPortfolio % |
|---|---|---|---|---|
| 0.08 | 103.24 | 5.9004 | 1.4459 | |
| 0.04 | 40.90 | 2.3373 | 1.3065 | |
| 0.24 | 121.11 | 6.9219 | 1.2863 | |
| 0.23 | 63.06 | 3.6040 | 1.2368 | |
| 0.12 | 46.92 | 2.6819 | 1.2262 | |
| 0.21 | 78.48 | 4.4857 | 1.2189 | |
| 0.07 | 28.51 | 1.6296 | 1.1933 | |
| 0.11 | 52.09 | 2.9769 | 0.9936 | |
| 0.83 | 35.57 | 2.0327 | 0.9151 | |
| 0.22 | 49.83 | 2.8478 | 0.7314 |
Top Decreases This Quarter
We use the change in the portfolio allocation because this is the most meaningful metric. Changes can be due to trades or changes in share prices.
| Security | Shares (MM) |
Value (MM$) |
Portfolio % | ΔPortfolio % |
|---|---|---|---|---|
| 0.01 | 0.83 | 0.0476 | -2.3437 | |
| 0.01 | 1.13 | 0.0647 | -1.7959 | |
| 0.27 | 46.60 | 2.6633 | -1.3470 | |
| 0.49 | 100.01 | 5.7159 | -0.9836 | |
| 0.48 | 43.82 | 2.5046 | -0.8052 | |
| 0.09 | 14.80 | 0.8460 | -0.8010 | |
| 0.14 | 21.62 | 1.2356 | -0.7980 | |
| 0.06 | 49.85 | 2.8493 | -0.4161 | |
| 0.31 | 49.01 | 2.8009 | -0.3894 | |
| 0.19 | 43.65 | 2.4945 | -0.2363 |
13F and Fund Filings
This form was filed on 2025-07-18 for the reporting period 2025-06-30. Click the link icon to see the full transaction history.
Upgrade to unlock premium data and export to Excel ![]() .
.
| Security | Type | Avg Share Price | Shares (MM) |
ΔShares (%) |
ΔShares (%) |
Value ($MM) |
Portfolio (%) |
ΔPortfolio (%) |
|
|---|---|---|---|---|---|---|---|---|---|
| MSFT / Microsoft Corporation | 0.24 | -5.10 | 121.11 | 25.75 | 6.9219 | 1.2863 | |||
| NFLX / Netflix, Inc. | 0.08 | -5.56 | 103.24 | 35.62 | 5.9004 | 1.4459 | |||
| AAPL / Apple Inc. | 0.49 | -5.43 | 100.01 | -12.65 | 5.7159 | -0.9836 | |||
| GOOGL / Alphabet Inc. | 0.49 | -5.29 | 86.50 | 7.93 | 4.9440 | 0.2543 | |||
| AMZN / Amazon.com, Inc. | 0.36 | -5.53 | 79.83 | 8.94 | 4.5626 | 0.2745 | |||
| PWR / Quanta Services, Inc. | 0.21 | -5.49 | 78.48 | 40.58 | 4.4857 | 1.2189 | |||
| AVGO / Broadcom Inc. | 0.23 | -5.33 | 63.06 | 55.87 | 3.6040 | 1.2368 | |||
| CHD / Church & Dwight Co., Inc. | 0.58 | 9.90 | 55.87 | -4.06 | 3.1930 | -0.2143 | |||
| ULTA / Ulta Beauty, Inc. | 0.11 | 20.40 | 52.09 | 53.67 | 2.9769 | 0.9936 | |||
| PODD / Insulet Corporation | 0.16 | -5.36 | 50.88 | 13.23 | 2.9081 | 0.2786 | |||
| LLY / Eli Lilly and Company | 0.06 | -5.35 | 49.85 | -10.66 | 2.8493 | -0.4161 | |||
| TSM / Taiwan Semiconductor Manufacturing Company Limited - Depositary Receipt (Common Stock) | 0.22 | 0.97 | 49.83 | 37.77 | 2.8478 | 0.7314 | |||
| CRM / Salesforce, Inc. | 0.18 | -5.39 | 49.53 | -3.87 | 2.8310 | -0.1840 | |||
| ZTS / Zoetis Inc. | 0.31 | -5.10 | 49.01 | -10.11 | 2.8009 | -0.3894 | |||
| LH / Labcorp Holdings Inc. | 0.19 | -5.72 | 48.95 | 6.34 | 2.7976 | 0.1041 | |||
| CL / Colgate-Palmolive Company | 0.54 | 39.89 | 48.85 | 35.71 | 2.7922 | 0.6857 | |||
| CYBR / CyberArk Software Ltd. | 0.12 | 56.69 | 46.92 | 88.62 | 2.6819 | 1.2262 | |||
| BDX / Becton, Dickinson and Company | 0.27 | -9.58 | 46.60 | -32.01 | 2.6633 | -1.3470 | |||
| SCHW / The Charles Schwab Corporation | 0.48 | -33.53 | 43.82 | -22.53 | 2.5046 | -0.8052 | |||
| WM / Waste Management, Inc. | 0.19 | -5.38 | 43.65 | -6.48 | 2.4945 | -0.2363 | |||
| MA / Mastercard Incorporated | 0.08 | -4.53 | 43.04 | -2.13 | 2.4598 | -0.1133 | |||
| PANW / Palo Alto Networks, Inc. | 0.20 | -5.48 | 41.25 | 13.35 | 2.3573 | 0.2282 | |||
| NOW / ServiceNow, Inc. | 0.04 | 79.76 | 40.90 | 132.13 | 2.3373 | 1.3065 | |||
| PINS / Pinterest, Inc. | 1.13 | -5.66 | 40.67 | 9.13 | 2.3242 | 0.1438 | |||
| WST / West Pharmaceutical Services, Inc. | 0.17 | -4.89 | 36.17 | -7.05 | 2.0672 | -0.2097 | |||
| CHWY / Chewy, Inc. | 0.83 | 42.04 | 35.57 | 86.21 | 2.0327 | 0.9151 | |||
| SNPS / Synopsys, Inc. | 0.06 | -4.03 | 29.79 | 14.73 | 1.7028 | 0.1833 | |||
| ECL / Ecolab Inc. | 0.11 | -5.24 | 28.86 | 0.71 | 1.6495 | -0.0273 | |||
| IWF / iShares Trust - iShares Russell 1000 Growth ETF | 0.07 | 225.22 | 28.51 | 282.40 | 1.6296 | 1.1933 | |||
| MKC / McCormick & Company, Incorporated | 0.35 | -3.82 | 26.46 | -11.40 | 1.5121 | -0.2353 | |||
| COST / Costco Wholesale Corporation | 0.02 | -4.92 | 23.66 | -0.48 | 1.3523 | -0.0389 | |||
| QCOM / QUALCOMM Incorporated | 0.14 | -40.00 | 21.62 | -37.79 | 1.2356 | -0.7980 | |||
| CTAS / Cintas Corporation | 0.08 | -5.55 | 17.70 | 2.42 | 1.0117 | 0.0004 | |||
| STZ / Constellation Brands, Inc. | 0.09 | -40.67 | 14.80 | -47.41 | 0.8460 | -0.8010 | |||
| BIL / SPDR Series Trust - SPDR Bloomberg 1-3 Month T-Bill ETF | 0.08 | 208.37 | 7.35 | 208.48 | 0.4200 | 0.2805 | |||
| SPY / SPDR S&P 500 ETF | 0.00 | -20.01 | 2.14 | -11.67 | 0.1225 | -0.0195 | |||
| VRNA / Verona Pharma plc - Depositary Receipt (Common Stock) | 0.02 | -46.37 | 2.14 | -20.13 | 0.1223 | -0.0344 | |||
| MMSI / Merit Medical Systems, Inc. | 0.02 | -36.91 | 1.87 | -44.21 | 0.1068 | -0.0892 | |||
| ARQT / Arcutis Biotherapeutics, Inc. | 0.11 | -45.44 | 1.60 | -51.10 | 0.0913 | -0.0998 | |||
| JPM / JPMorgan Chase & Co. | 0.01 | -35.52 | 1.53 | -23.77 | 0.0876 | -0.0301 | |||
| HD / The Home Depot, Inc. | 0.00 | -0.42 | 1.29 | -0.39 | 0.0739 | -0.0021 | |||
| EXLS / ExlService Holdings, Inc. | 0.03 | -45.90 | 1.29 | -49.83 | 0.0739 | -0.0769 | |||
| COCO / The Vita Coco Company, Inc. | 0.03 | -46.39 | 1.23 | -36.85 | 0.0704 | -0.0438 | |||
| KNSA / Kiniksa Pharmaceuticals, Ltd. | 0.04 | -44.47 | 1.19 | -30.84 | 0.0682 | -0.0327 | |||
| SBUX / Starbucks Corporation | 0.01 | -96.19 | 1.13 | -96.44 | 0.0647 | -1.7959 | |||
| VCYT / Veracyte, Inc. | 0.04 | -17.69 | 1.08 | -24.97 | 0.0617 | -0.0225 | |||
| DPZ / Domino's Pizza, Inc. | 0.00 | -0.55 | 1.06 | -2.49 | 0.0605 | -0.0030 | |||
| SRRK / Scholar Rock Holding Corporation | 0.03 | 1.05 | 0.0599 | 0.0599 | |||||
| MDGL / Madrigal Pharmaceuticals, Inc. | 0.00 | -37.45 | 1.04 | -42.83 | 0.0595 | -0.0471 | |||
| SO / The Southern Company | 0.01 | -0.65 | 1.03 | -0.77 | 0.0586 | -0.0019 | |||
| MCD / McDonald's Corporation | 0.00 | -0.62 | 1.03 | -7.07 | 0.0586 | -0.0059 | |||
| HALO / Halozyme Therapeutics, Inc. | 0.02 | -45.57 | 1.02 | -55.64 | 0.0585 | -0.0765 | |||
| CGON / CG Oncology, Inc. | 0.04 | 1.00 | 0.0572 | 0.0572 | |||||
| ELF / e.l.f. Beauty, Inc. | 0.01 | -15.00 | 0.98 | 68.45 | 0.0559 | 0.0219 | |||
| JNJ / Johnson & Johnson | 0.01 | -0.59 | 0.98 | -8.36 | 0.0557 | -0.0066 | |||
| PKG / Packaging Corporation of America | 0.01 | 59.61 | 0.97 | 52.04 | 0.0553 | 0.0180 | |||
| CVX / Chevron Corporation | 0.01 | -0.55 | 0.92 | -14.84 | 0.0528 | -0.0107 | |||
| CWST / Casella Waste Systems, Inc. | 0.01 | -45.18 | 0.90 | -43.30 | 0.0515 | -0.0415 | |||
| ROP / Roper Technologies, Inc. | 0.00 | -1.70 | 0.88 | -5.56 | 0.0505 | -0.0042 | |||
| GLW / Corning Incorporated | 0.02 | 0.87 | 0.0498 | 0.0498 | |||||
| GTLB / GitLab Inc. | 0.02 | -31.53 | 0.86 | -34.25 | 0.0492 | -0.0274 | |||
| PEP / PepsiCo, Inc. | 0.01 | -97.68 | 0.83 | -97.96 | 0.0476 | -2.3437 | |||
| GENI / Genius Sports Limited | 0.08 | -28.85 | 0.83 | -26.07 | 0.0475 | -0.0183 | |||
| VRNS / Varonis Systems, Inc. | 0.02 | -41.03 | 0.83 | -26.09 | 0.0473 | -0.0182 | |||
| SRE / Sempra | 0.01 | -0.56 | 0.80 | 5.53 | 0.0459 | 0.0014 | |||
| PRIM / Primoris Services Corporation | 0.01 | -45.94 | 0.78 | -26.65 | 0.0446 | -0.0176 | |||
| GXO / GXO Logistics, Inc. | 0.02 | -40.67 | 0.76 | -26.09 | 0.0436 | -0.0168 | |||
| BRZE / Braze, Inc. | 0.02 | -17.57 | 0.70 | -35.81 | 0.0401 | -0.0238 | |||
| S / SentinelOne, Inc. | 0.04 | -14.18 | 0.69 | -13.68 | 0.0397 | -0.0074 | |||
| GSK / GSK plc - Depositary Receipt (Common Stock) | 0.02 | -0.56 | 0.69 | -1.44 | 0.0392 | -0.0015 | |||
| SMPL / The Simply Good Foods Company | 0.02 | -45.00 | 0.68 | -49.66 | 0.0386 | -0.0399 | |||
| ITRI / Itron, Inc. | 0.00 | -46.96 | 0.65 | -33.40 | 0.0373 | -0.0200 | |||
| STVN / Stevanato Group S.p.A. | 0.03 | -46.35 | 0.64 | -35.79 | 0.0364 | -0.0217 | |||
| MRK / Merck & Co., Inc. | 0.01 | -0.56 | 0.63 | -12.31 | 0.0362 | -0.0061 | |||
| APPF / AppFolio, Inc. | 0.00 | -45.99 | 0.63 | -43.49 | 0.0358 | -0.0290 | |||
| BR / Broadridge Financial Solutions, Inc. | 0.00 | -0.60 | 0.61 | -0.33 | 0.0346 | -0.0010 | |||
| CNMD / CONMED Corporation | 0.01 | -36.68 | 0.57 | -45.48 | 0.0328 | -0.0287 | |||
| BFAM / Bright Horizons Family Solutions Inc. | 0.00 | -44.66 | 0.53 | -46.18 | 0.0302 | -0.0272 | |||
| SPSC / SPS Commerce, Inc. | 0.00 | -37.34 | 0.50 | -35.82 | 0.0285 | -0.0169 | |||
| WSC / WillScot Holdings Corporation | 0.02 | -44.39 | 0.49 | -45.19 | 0.0280 | -0.0243 | |||
| IBTA / Ibotta, Inc. | 0.01 | -35.14 | 0.27 | -43.85 | 0.0157 | -0.0129 | |||
| PLTR / Palantir Technologies Inc. | 0.00 | 0.27 | 0.0156 | 0.0156 | |||||
| SITE / SiteOne Landscape Supply, Inc. | 0.00 | -42.30 | 0.27 | -42.52 | 0.0152 | -0.0119 | |||
| DIS / The Walt Disney Company | 0.00 | -20.46 | 0.25 | 0.00 | 0.0144 | -0.0004 | |||
| CVLT / Commvault Systems, Inc. | 0.00 | 0.25 | 0.0144 | 0.0144 | |||||
| BPMC / Blueprint Medicines Corporation | 0.00 | -100.00 | 0.00 | 0.0000 | |||||
| SWTX / SpringWorks Therapeutics, Inc. | 0.00 | -100.00 | 0.00 | 0.0000 | |||||
| CCCS / CCC Intelligent Solutions Holdings Inc. | 0.00 | -100.00 | 0.00 | 0.0000 | |||||
| MDLZ / Mondelez International, Inc. | 0.00 | -100.00 | 0.00 | 0.0000 | |||||
| TENB / Tenable Holdings, Inc. | 0.00 | -100.00 | 0.00 | 0.0000 | |||||
| PD / PagerDuty, Inc. | 0.00 | -100.00 | 0.00 | 0.0000 | |||||
| FRPT / Freshpet, Inc. | 0.00 | -100.00 | 0.00 | 0.0000 | |||||
| IWO / iShares Trust - iShares Russell 2000 Growth ETF | 0.00 | -100.00 | 0.00 | 0.0000 | |||||
| IWB / iShares Trust - iShares Russell 1000 ETF | 0.00 | -100.00 | 0.00 | 0.0000 | |||||
| ADBE / Adobe Inc. | 0.00 | -100.00 | 0.00 | 0.0000 |