Basic Stats
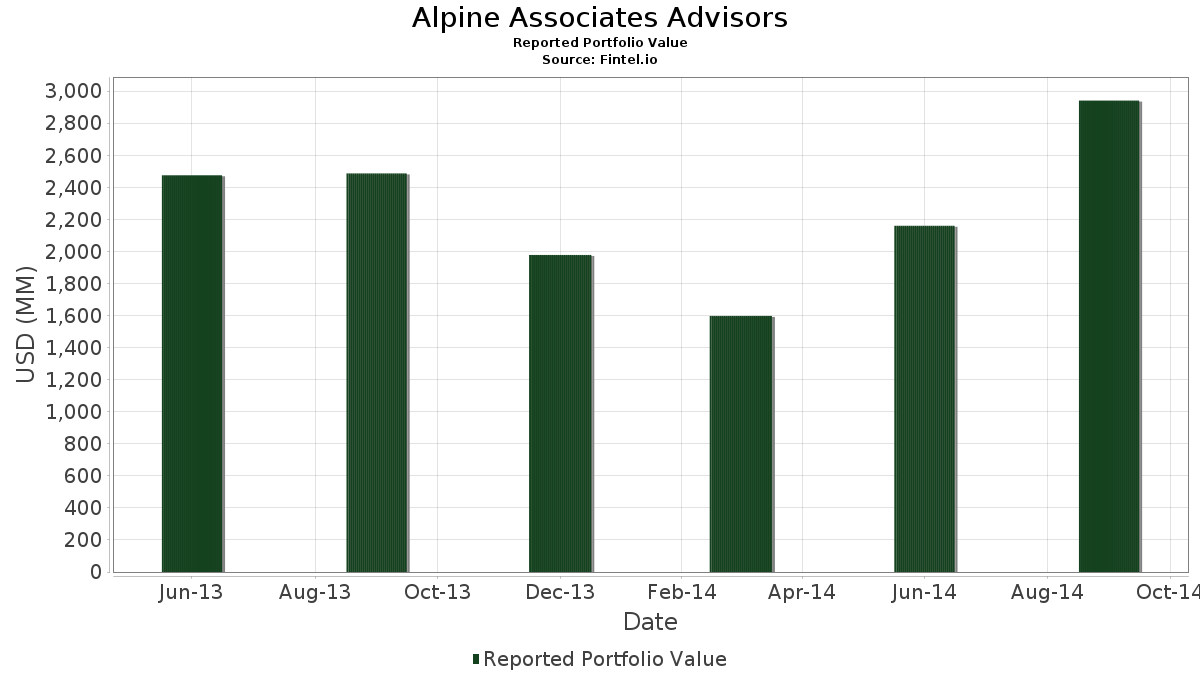
| Portfolio Value | $ 157,799,516 |
| Current Positions | 79 |
Latest Holdings, Performance, AUM (from 13F, 13D)
Alpine Associates Advisors has disclosed 79 total holdings in their latest SEC filings. Most recent portfolio value is calculated to be $ 157,799,516 USD. Actual Assets Under Management (AUM) is this value plus cash (which is not disclosed). Alpine Associates Advisors’s top holdings are Cemex S.A.B de C.V. Bond 3.750% 3/1 (US:151290BC6) , Wesco International, Inc. 6.0% Convertible Senior Debenturesentures Due 09/15/16 (US:95082PAH8) , Hudson City Bancorp, Inc. (US:HCBK) , Banco Santander (Brasil) S.A. - Depositary Receipt (Common Stock) (US:BSBR) , and American Realty Capital Healthcare Trust Inc (US:HCT) . Alpine Associates Advisors’s new positions include Cemex S.A.B de C.V. Bond 3.750% 3/1 (US:151290BC6) , Wesco International, Inc. 6.0% Convertible Senior Debenturesentures Due 09/15/16 (US:95082PAH8) , Ocean Thermal Energy Corporation (US:CPWR) , Glimcher Realty Trust (US:GRT.PRH) , and International Game Technology PLC (US:IGT) .
Top Increases This Quarter
We use the change in the portfolio allocation because this is the most meaningful metric. Changes can be due to trades or changes in share prices.
| Security | Shares (MM) |
Value (MM$) |
Portfolio % | ΔPortfolio % |
|---|---|---|---|---|
| 21.00 | 13.3080 | 13.3080 | ||
| 0.05 | 4.31 | 2.7303 | 2.7303 | |
| 0.06 | 4.23 | 2.6775 | 2.6775 | |
| 0.06 | 3.54 | 2.2402 | 2.2402 | |
| 0.00 | 2.05 | 1.2982 | 1.2982 | |
| 0.03 | 1.81 | 1.1452 | 1.1452 | |
| 0.13 | 1.76 | 1.1141 | 1.1141 | |
| 0.09 | 1.62 | 1.0295 | 1.0295 | |
| 0.16 | 1.56 | 0.9896 | 0.9896 | |
| 0.06 | 1.51 | 0.9556 | 0.9556 |
Top Decreases This Quarter
We use the change in the portfolio allocation because this is the most meaningful metric. Changes can be due to trades or changes in share prices.
| Security | Shares (MM) |
Value (MM$) |
Portfolio % | ΔPortfolio % |
|---|---|---|---|---|
| 0.20 | 2.28 | 1.4439 | -4.2400 | |
| 0.07 | 0.50 | 0.3181 | -4.1776 | |
| 0.09 | 9.16 | 0.0058 | -4.0575 | |
| 0.03 | 0.19 | 0.1235 | -3.9325 | |
| 0.06 | 2.23 | 0.0014 | -3.4072 | |
| 15.00 | 0.0095 | -2.1200 | ||
| 0.02 | 1.09 | 0.0007 | -1.5424 | |
| 0.01 | 0.74 | 0.0005 | -1.2244 | |
| 0.02 | 0.90 | 0.0006 | -1.2212 | |
| 0.02 | 0.23 | 0.0001 | -1.1977 |
13F and Fund Filings
This form was filed on 2014-12-18 for the reporting period 2014-09-30. Click the link icon to see the full transaction history.
Upgrade to unlock premium data and export to Excel ![]() .
.
| Security | Type | Avg Share Price | Shares (MM) |
ΔShares (%) |
ΔShares (%) |
Value ($MM) |
Portfolio (%) |
ΔPortfolio (%) |
|
|---|---|---|---|---|---|---|---|---|---|
| OMNICARE INC / NOTE 3.75% 4/0 (681904AP3) | 25.00 | 549.69 | 0.0158 | 0.0158 | |||||
| 151290BC6 / Cemex S.A.B de C.V. Bond 3.750% 3/1 | 21.00 | 13.3080 | 13.3080 | ||||||
| 95082PAH8 / Wesco International, Inc. 6.0% Convertible Senior Debenturesentures Due 09/15/16 | 15.00 | -67.39 | 0.0095 | -2.1200 | |||||
| HCBK / Hudson City Bancorp, Inc. | 0.09 | -99.00 | 9.16 | -89.56 | 0.0058 | -4.0575 | |||
| BSBR / Banco Santander (Brasil) S.A. - Depositary Receipt (Common Stock) | 0.03 | -97.34 | 5.09 | -41.13 | 0.0032 | 0.0032 | |||
| HCT / American Realty Capital Healthcare Trust Inc | 0.05 | -97.59 | 4.73 | -78.84 | 0.0030 | 0.0030 | |||
| CPWR / Ocean Thermal Energy Corporation | 0.05 | 4.31 | 2.7303 | 2.7303 | |||||
| CUBIST PHARMACEUTICALS INC / RIGHT 99/99/9999 (229678123) | 0.00 | -99.99 | 4.27 | -55.93 | 0.0027 | 0.0027 | |||
| GRT.PRH / Glimcher Realty Trust | 0.06 | 4.23 | 2.6775 | 2.6775 | |||||
| CYH / Community Health Systems, Inc. | 0.00 | -100.00 | 4.16 | 1,395.68 | 0.0026 | -0.0102 | |||
| IGT / International Game Technology PLC | 0.06 | 3.54 | 2.2402 | 2.2402 | |||||
| GULTU / Gulf Coast Ultra Deep Royalty Trust | 0.01 | -99.82 | 3.33 | -69.34 | 0.0021 | 0.0021 | |||
| RF / Regions Financial Corporation | 0.03 | -97.75 | 2.52 | -78.94 | 0.0016 | -0.5513 | |||
| HBAN / Huntington Bancshares Incorporated | 0.02 | -97.83 | 2.51 | -76.59 | 0.0016 | -0.4951 | |||
| COV / | 0.21 | -86.18 | 2.39 | -98.23 | 0.0015 | 0.0015 | |||
| DTV / DTE Energy Company | 0.20 | -86.35 | 2.28 | -98.14 | 1.4439 | -4.2400 | |||
| LNCO / Linn Co, LLC | 0.06 | -97.26 | 2.23 | -96.97 | 0.0014 | -3.4072 | |||
| BTG / B2Gold Corp. | 0.00 | 2.05 | 1.2982 | 1.2982 | |||||
| TQNT / | 0.03 | 1.81 | 1.1452 | 1.1452 | |||||
| ROC / ROC Energy Acquisition Corp | 0.13 | 1.76 | 1.1141 | 1.1141 | |||||
| SWYDF / Stornoway Diamond Corporation | 0.06 | -96.41 | 1.67 | -96.96 | 0.0011 | 0.0011 | |||
| ATHL / | 0.09 | 1.62 | 1.0295 | 1.0295 | |||||
| CONVERSANT INC / (21249J105) | 0.06 | 1.61 | 0.0010 | 0.0010 | |||||
| TRW / TRW Automotive Holdings | 0.16 | 1.56 | 0.9896 | 0.9896 | |||||
| IRF / International Rectifier Corp | 0.06 | 1.51 | 0.9556 | 0.9556 | |||||
| KOG / | 0.02 | 1.40 | 0.8870 | 0.8870 | |||||
| TRLA / | 0.07 | 1.40 | 0.8858 | 0.8858 | |||||
| PL.PRE / Protective Life Corp. | 0.09 | -89.50 | 1.31 | -97.82 | 0.0008 | 0.0008 | |||
| 81941U105 / Shanda Games Limited | 0.01 | -99.08 | 1.30 | -78.88 | 0.0008 | -0.2839 | |||
| MOVE / Movano Inc. | 0.02 | 1.19 | 0.7548 | 0.7548 | |||||
| TWTC / | 0.05 | -94.78 | 1.16 | -96.89 | 0.0007 | 0.0007 | |||
| POM / PEPCO Holdings, Inc. | 0.03 | -93.86 | 1.15 | -91.65 | 0.0007 | 0.0007 | |||
| LO / | 0.07 | 1.11 | 0.7013 | 0.7013 | |||||
| LOPE / Grand Canyon Education, Inc. | 0.02 | -98.03 | 1.09 | -96.74 | 0.0007 | -1.5424 | |||
| URS / Urs Corp | 0.06 | 1.04 | 0.6576 | 0.6576 | |||||
| CNQR / | 0.12 | 0.97 | 0.6153 | 0.6153 | |||||
| BYI / | 0.08 | 0.95 | 0.6038 | 0.6038 | |||||
| THI / Tim Hortons, Inc. | 0.07 | 0.94 | 0.5942 | 0.5942 | |||||
| ARNC / Arconic Corporation | 0.01 | -98.40 | 0.93 | -93.33 | 0.0006 | -0.6454 | |||
| NVGS / Navigator Holdings Ltd. | 0.02 | -97.22 | 0.90 | -96.60 | 0.0006 | -1.2212 | |||
| T / AT&T Inc. | Put | 0.03 | -97.12 | 0.87 | -97.69 | 0.0006 | 0.0006 | ||
| MONT / Montage Technology Group Ltd | 0.02 | -97.80 | 0.87 | -94.91 | 0.5508 | -0.2396 | |||
| GFIG / GFI Group, Inc. | 0.00 | 0.76 | 0.4805 | 0.4805 | |||||
| BAC / Bank of America Corporation | 0.01 | -98.88 | 0.74 | -96.20 | 0.0005 | -1.2244 | |||
| FDO / | 0.05 | 0.64 | 0.4075 | 0.4075 | |||||
| DRC / | 0.05 | 0.59 | 0.3766 | 0.3766 | |||||
| SIAL / Sigma-Aldrich Corporation | 0.07 | 0.54 | 0.3426 | 0.3426 | |||||
| TWC / Spectrum Management Holding Company LLC | 0.07 | -89.07 | 0.50 | -99.48 | 0.3181 | -4.1776 | |||
| AMAT / Applied Materials, Inc. | Call | 0.01 | 0.50 | 0.3169 | 0.3169 | ||||
| GTIV / Gentiva Health Services Inc | 0.01 | -97.33 | 0.49 | -89.42 | 0.0003 | 0.0003 | |||
| TIBX / Tibco Software | 0.01 | 0.43 | 0.2746 | 0.2746 | |||||
| MGAM / Mobile Global Esports Inc. | 0.01 | 0.38 | 0.2381 | 0.2381 | |||||
| PWR / Quanta Services, Inc. | 0.01 | -95.20 | 0.37 | -96.19 | 0.0002 | 0.0002 | |||
| BCE / BCE Inc. | 0.02 | 0.36 | 0.2266 | 0.2266 | |||||
| BNNY / Annie's, Inc. | 0.01 | 0.32 | 0.2042 | 0.2042 | |||||
| BAGL / Einstein Noah Restaurant Group Inc | 0.01 | 0.30 | 0.1901 | 0.1901 | |||||
| TEG / Integrys Energy Group, Inc. | 0.02 | -93.27 | 0.26 | -98.54 | 0.0002 | 0.0002 | |||
| AAPL / Apple Inc. | 0.02 | -91.58 | 0.23 | -99.10 | 0.0001 | -1.1977 | |||
| 018490100 / Allergan plc | 0.03 | -93.29 | 0.19 | -99.78 | 0.1235 | -3.9325 | |||
| DAL / Delta Air Lines, Inc. | 0.01 | -97.61 | 0.19 | -98.29 | 0.0001 | -0.5038 | |||
| LYB / LyondellBasell Industries N.V. | 0.02 | -91.04 | 0.19 | -99.16 | 0.0001 | -1.0212 | |||
| VLO / Valero Energy Corporation | 0.01 | -90.91 | 0.19 | -96.31 | 0.0001 | 0.0001 | |||
| BPR / Brookfield Property REIT Inc. | 0.00 | -98.91 | 0.16 | -97.51 | 0.0001 | 0.0001 | |||
| BKW / Burger King Worldwide Inc. | Put | 0.00 | 0.16 | 0.1028 | 0.1028 | ||||
| FDO / | Call | 0.01 | 0.15 | 0.0951 | 0.0951 | ||||
| MKTX / MarketAxess Holdings Inc. | 0.01 | 0.13 | 0.0802 | 0.0802 | |||||
| RHP / Ryman Hospitality Properties, Inc. | 0.01 | -67.76 | 0.12 | -83.70 | 0.0001 | 0.0001 | |||
| 018490100 / Allergan plc | Call | 0.02 | -72.28 | 0.11 | -99.08 | 0.0710 | -0.4931 | ||
| VODPF / Vodafone Group Public Limited Company | Call | 0.00 | -96.71 | 0.10 | -70.00 | 0.0001 | -0.0161 | ||
| PETSMART / CALL (716768906) | Call | 0.01 | 0.10 | 0.0001 | 0.0001 | ||||
| LORILLARD INC / PUT (544147951) | Put | 0.01 | 0.10 | 0.0001 | 0.0001 | ||||
| DTV / DTE Energy Company | Call | 0.01 | -91.35 | 0.10 | -98.82 | 0.0634 | -0.3302 | ||
| MNKKQ / Mallinckrodt Plc | Put | 0.01 | 0.10 | 0.0634 | 0.0634 | ||||
| CELG / Celgene Corp. | 0.01 | -89.06 | 0.09 | -99.32 | 0.0001 | -0.6868 | |||
| AZN / AstraZeneca PLC - Depositary Receipt (Common Stock) | Call | 0.01 | -96.94 | 0.09 | -99.43 | 0.0001 | 0.0001 | ||
| TWC / Spectrum Management Holding Company LLC | Call | 0.01 | -85.65 | 0.07 | -99.30 | 0.0475 | -0.4500 | ||
| MNKKQ / Mallinckrodt Plc | 0.01 | 0.07 | 0.0427 | 0.0427 | |||||
| COVIDIEN PLC / CALL (G2554F903) | Call | 0.00 | -91.35 | 0.04 | -98.91 | 0.0000 | 0.0000 | ||
| BKW / Burger King Worldwide Inc. | 0.00 | 0.02 | 0.0142 | 0.0142 |