Basic Stats
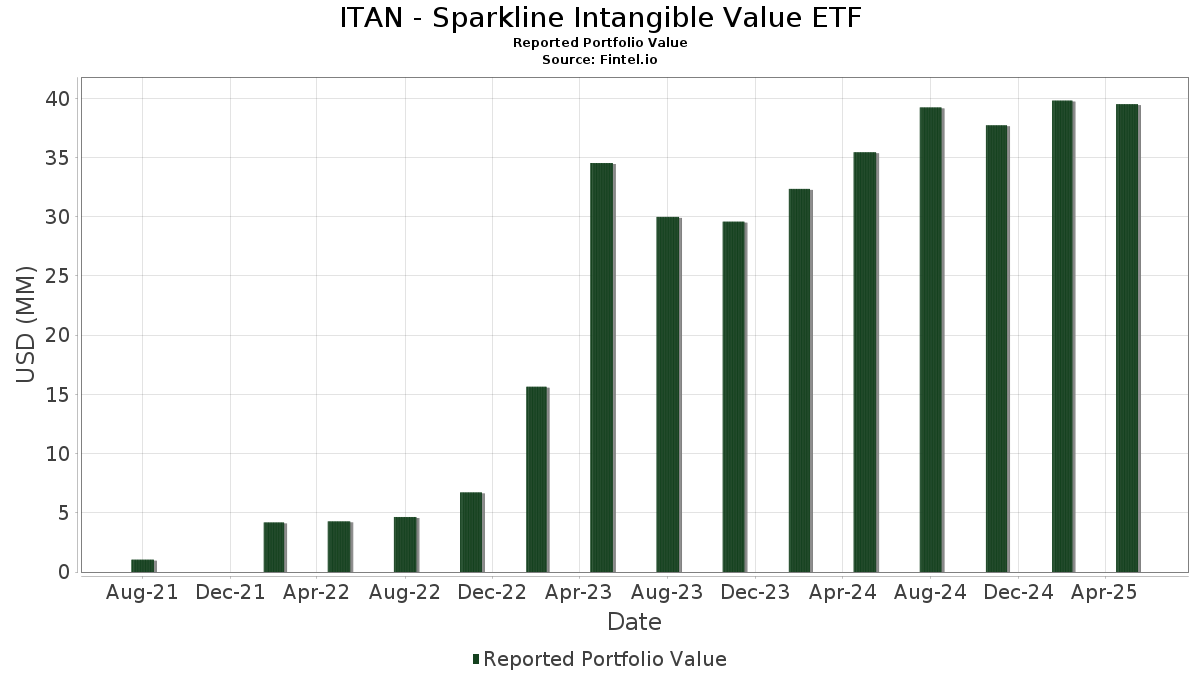
| Portfolio Value | $ 39,507,885 |
| Current Positions | 155 |
Latest Holdings, Performance, AUM (from 13F, 13D)
ITAN - Sparkline Intangible Value ETF has disclosed 155 total holdings in their latest SEC filings. Most recent portfolio value is calculated to be $ 39,507,885 USD. Actual Assets Under Management (AUM) is this value plus cash (which is not disclosed). ITAN - Sparkline Intangible Value ETF’s top holdings are Amazon.com, Inc. (US:AMZN) , Alphabet Inc. (US:GOOGL) , Alphabet Inc. (US:GOOG) , International Business Machines Corporation (US:IBM) , and Oracle Corporation (US:ORCL) . ITAN - Sparkline Intangible Value ETF’s new positions include First American Funds Inc - First American Government Obligations Fund Class X (US:FGXXX) , Uber Technologies, Inc. (US:UBER) , DuPont de Nemours, Inc. (US:DD) , PPG Industries, Inc. (US:PPG) , and Dow Inc. (US:DOW) .
Top Increases This Quarter
We use the change in the portfolio allocation because this is the most meaningful metric. Changes can be due to trades or changes in share prices.
| Security | Shares (MM) |
Value (MM$) |
Portfolio % | ΔPortfolio % |
|---|---|---|---|---|
| 0.00 | 0.26 | 0.6500 | 0.6500 | |
| 0.01 | 0.49 | 1.2300 | 0.5900 | |
| 0.00 | 0.22 | 0.5700 | 0.5700 | |
| 0.00 | 0.35 | 0.8800 | 0.4800 | |
| 0.00 | 0.16 | 0.4100 | 0.4100 | |
| 0.00 | 0.16 | 0.3900 | 0.3900 | |
| 0.01 | 0.15 | 0.3800 | 0.3800 | |
| 0.00 | 0.14 | 0.3600 | 0.3600 | |
| 0.28 | 0.7200 | 0.3500 | ||
| 0.00 | 0.12 | 0.3000 | 0.3000 |
Top Decreases This Quarter
We use the change in the portfolio allocation because this is the most meaningful metric. Changes can be due to trades or changes in share prices.
| Security | Shares (MM) |
Value (MM$) |
Portfolio % | ΔPortfolio % |
|---|---|---|---|---|
| 0.00 | 0.00 | -0.8800 | ||
| 0.00 | 0.00 | -0.5000 | ||
| 0.00 | 0.00 | -0.4000 | ||
| 0.00 | 0.18 | 0.4500 | -0.3500 | |
| 0.00 | 0.00 | -0.3300 | ||
| 0.02 | 0.46 | 1.1600 | -0.2900 | |
| 0.00 | 0.00 | -0.2800 | ||
| 0.00 | 0.00 | -0.2700 | ||
| 0.00 | 0.00 | -0.2500 | ||
| 0.00 | 0.63 | 1.6100 | -0.2400 |
13F and Fund Filings
This form was filed on 2025-07-30 for the reporting period 2025-05-30. Click the link icon to see the full transaction history.
Upgrade to unlock premium data and export to Excel ![]() .
.
| Security | Type | Avg Share Price | Shares (MM) |
ΔShares (%) |
ΔShares (%) |
Value ($MM) |
Portfolio (%) |
ΔPortfolio (%) |
|
|---|---|---|---|---|---|---|---|---|---|
| AMZN / Amazon.com, Inc. | 0.01 | 14.04 | 1.88 | 10.15 | 4.7600 | 0.2300 | |||
| GOOGL / Alphabet Inc. | 0.00 | 14.04 | 0.81 | 14.96 | 2.0500 | 0.1900 | |||
| GOOG / Alphabet Inc. | 0.00 | 13.71 | 0.80 | 14.20 | 2.0400 | 0.1700 | |||
| IBM / International Business Machines Corporation | 0.00 | 3.09 | 0.76 | 5.86 | 1.9300 | 0.0200 | |||
| ORCL / Oracle Corporation | 0.00 | -6.61 | 0.73 | -6.93 | 1.8400 | -0.2300 | |||
| CSCO / Cisco Systems, Inc. | 0.01 | -2.36 | 0.70 | -4.00 | 1.7700 | -0.1600 | |||
| T / AT&T Inc. | 0.02 | -4.27 | 0.69 | -2.96 | 1.7500 | -0.1300 | |||
| CRM / Salesforce, Inc. | 0.00 | 2.31 | 0.63 | -8.91 | 1.6100 | -0.2400 | |||
| QCOM / QUALCOMM Incorporated | 0.00 | 14.05 | 0.63 | 5.49 | 1.6100 | 0.0100 | |||
| ACN / Accenture plc | 0.00 | 18.37 | 0.61 | 7.58 | 1.5500 | 0.0400 | |||
| WFC / Wells Fargo & Company | 0.01 | 6.04 | 0.58 | 1.22 | 1.4800 | -0.0500 | |||
| PFE / Pfizer Inc. | 0.02 | 16.55 | 0.58 | 3.57 | 1.4700 | -0.0200 | |||
| VZ / Verizon Communications Inc. | 0.01 | 0.41 | 0.56 | 2.37 | 1.4300 | -0.0300 | |||
| TMUS / T-Mobile US, Inc. | 0.00 | -0.53 | 0.54 | -10.60 | 1.3700 | -0.2400 | |||
| DIS / The Walt Disney Company | 0.00 | 18.65 | 0.53 | 17.96 | 1.3500 | 0.1500 | |||
| RTX / RTX Corporation | 0.00 | 2.18 | 0.53 | 4.79 | 1.3300 | 0.0000 | |||
| BA / The Boeing Company | 0.00 | -4.16 | 0.53 | 13.88 | 1.3300 | 0.1100 | |||
| MDT / Medtronic plc | 0.01 | 11.62 | 0.51 | 0.60 | 1.2900 | -0.0500 | |||
| HON / Honeywell International Inc. | 0.00 | 6.28 | 0.49 | 13.04 | 1.2500 | 0.0900 | |||
| MRK / Merck & Co., Inc. | 0.01 | 140.74 | 0.49 | 100.83 | 1.2300 | 0.5900 | |||
| INTC / Intel Corporation | 0.02 | 1.53 | 0.46 | -16.33 | 1.1600 | -0.2900 | |||
| GILD / Gilead Sciences, Inc. | 0.00 | 1.32 | 0.44 | -2.45 | 1.1100 | -0.0800 | |||
| DELL / Dell Technologies Inc. | 0.00 | 6.15 | 0.43 | 14.97 | 1.0900 | 0.1000 | |||
| CVS / CVS Health Corporation | 0.01 | -2.08 | 0.43 | -4.69 | 1.0900 | -0.1000 | |||
| COF / Capital One Financial Corporation | 0.00 | 4.35 | 0.42 | -1.65 | 1.0600 | -0.0700 | |||
| CMCSA / Comcast Corporation | 0.01 | -0.57 | 0.39 | -4.23 | 0.9800 | -0.0900 | |||
| MMM / 3M Company | 0.00 | 9.06 | 0.38 | 4.42 | 0.9600 | 0.0000 | |||
| BMY / Bristol-Myers Squibb Company | 0.01 | 15.23 | 0.38 | -6.72 | 0.9500 | -0.1200 | |||
| MU / Micron Technology, Inc. | 0.00 | 19.11 | 0.37 | 20.13 | 0.9400 | 0.1200 | |||
| PYPL / PayPal Holdings, Inc. | 0.01 | -1.83 | 0.37 | -2.89 | 0.9400 | -0.0700 | |||
| XYZ / Block, Inc. | 0.01 | 46.32 | 0.36 | 38.70 | 0.9200 | 0.2300 | |||
| NOC / Northrop Grumman Corporation | 0.00 | 4.78 | 0.36 | 10.06 | 0.9200 | 0.0500 | |||
| GM / General Motors Company | 0.01 | 2.54 | 0.36 | 3.47 | 0.9100 | -0.0100 | |||
| LMT / Lockheed Martin Corporation | 0.00 | 114.33 | 0.35 | 130.67 | 0.8800 | 0.4800 | |||
| LHX / L3Harris Technologies, Inc. | 0.00 | -1.89 | 0.33 | 16.67 | 0.8300 | 0.0800 | |||
| TGT / Target Corporation | 0.00 | 21.79 | 0.32 | -7.69 | 0.8200 | -0.1100 | |||
| CMI / Cummins Inc. | 0.00 | 12.63 | 0.32 | -1.52 | 0.8200 | -0.0500 | |||
| BDX / Becton, Dickinson and Company | 0.00 | 47.37 | 0.32 | 12.72 | 0.8100 | 0.0600 | |||
| F / Ford Motor Company | 0.03 | 0.48 | 0.32 | 8.97 | 0.8000 | 0.0300 | |||
| CTSH / Cognizant Technology Solutions Corporation | 0.00 | 3.66 | 0.31 | 0.65 | 0.7900 | -0.0300 | |||
| CHTR / Charter Communications, Inc. | 0.00 | 0.13 | 0.30 | 8.79 | 0.7600 | 0.0400 | |||
| FDX / FedEx Corporation | 0.00 | 13.22 | 0.30 | -6.01 | 0.7500 | -0.0900 | |||
| ALL / The Allstate Corporation | 0.00 | -1.34 | 0.29 | 3.89 | 0.7500 | 0.0000 | |||
| EBAY / eBay Inc. | 0.00 | -4.88 | 0.29 | 7.78 | 0.7400 | 0.0200 | |||
| GD / General Dynamics Corporation | 0.00 | 8.63 | 0.29 | 20.08 | 0.7300 | 0.0900 | |||
| FGXXX / First American Funds Inc - First American Government Obligations Fund Class X | 0.28 | 105.07 | 0.7200 | 0.3500 | |||||
| JCI / Johnson Controls International plc | 0.00 | -7.09 | 0.27 | 10.04 | 0.7000 | 0.0400 | |||
| WDAY / Workday, Inc. | 0.00 | -0.67 | 0.26 | -6.55 | 0.6500 | -0.0800 | |||
| NXPI / NXP Semiconductors N.V. | 0.00 | 14.38 | 0.26 | 1.59 | 0.6500 | -0.0200 | |||
| TE Connectivity PLC / EC (N/A) | 0.00 | 0.26 | 0.6500 | 0.6500 | |||||
| UAL / United Airlines Holdings, Inc. | 0.00 | 15.39 | 0.25 | -2.39 | 0.6200 | -0.0500 | |||
| GLW / Corning Incorporated | 0.00 | 5.75 | 0.24 | 4.33 | 0.6100 | 0.0000 | |||
| WBD / Warner Bros. Discovery, Inc. | 0.02 | 10.98 | 0.24 | -3.27 | 0.6000 | -0.0500 | |||
| HPQ / HP Inc. | 0.01 | 14.04 | 0.24 | -7.81 | 0.6000 | -0.0800 | |||
| HPE / Hewlett Packard Enterprise Company | 0.01 | 11.20 | 0.23 | -3.36 | 0.5900 | -0.0400 | |||
| WDC / Western Digital Corporation | 0.00 | 28.19 | 0.23 | 34.73 | 0.5700 | 0.1300 | |||
| KR / The Kroger Co. | 0.00 | -0.15 | 0.23 | 5.14 | 0.5700 | 0.0000 | |||
| CNC / Centene Corporation | 0.00 | 3.34 | 0.22 | 0.45 | 0.5700 | -0.0200 | |||
| UBER / Uber Technologies, Inc. | 0.00 | 0.22 | 0.5700 | 0.5700 | |||||
| CAH / Cardinal Health, Inc. | 0.00 | -11.23 | 0.22 | 6.22 | 0.5600 | 0.0000 | |||
| TWLO / Twilio Inc. | 0.00 | 16.70 | 0.22 | 14.89 | 0.5500 | 0.0500 | |||
| NTAP / NetApp, Inc. | 0.00 | 10.04 | 0.22 | 9.64 | 0.5500 | 0.0300 | |||
| DOCU / DocuSign, Inc. | 0.00 | 6.97 | 0.21 | 13.83 | 0.5400 | 0.0400 | |||
| DAL / Delta Air Lines, Inc. | 0.00 | 29.07 | 0.21 | 3.92 | 0.5400 | 0.0000 | |||
| EXPE / Expedia Group, Inc. | 0.00 | -3.10 | 0.21 | -18.43 | 0.5300 | -0.1500 | |||
| BAX / Baxter International Inc. | 0.01 | 7.72 | 0.20 | -4.78 | 0.5100 | -0.0500 | |||
| PRU / Prudential Financial, Inc. | 0.00 | 13.77 | 0.20 | 2.60 | 0.5000 | -0.0100 | |||
| LDOS / Leidos Holdings, Inc. | 0.00 | 3.94 | 0.20 | 18.90 | 0.5000 | 0.0600 | |||
| LH / Labcorp Holdings Inc. | 0.00 | 8.58 | 0.20 | 7.73 | 0.5000 | 0.0200 | |||
| ZM / Zoom Communications Inc. | 0.00 | 3.31 | 0.19 | 13.61 | 0.4900 | 0.0400 | |||
| BIIB / Biogen Inc. | 0.00 | 25.76 | 0.19 | 16.36 | 0.4900 | 0.0500 | |||
| HUM / Humana Inc. | 0.00 | 15.45 | 0.19 | -0.52 | 0.4900 | -0.0200 | |||
| ILMN / Illumina, Inc. | 0.00 | 28.90 | 0.19 | 19.38 | 0.4900 | 0.0600 | |||
| JBL / Jabil Inc. | 0.00 | 8.97 | 0.19 | 17.83 | 0.4700 | 0.0500 | |||
| ROKU / Roku, Inc. | 0.00 | 22.87 | 0.19 | 6.32 | 0.4700 | 0.0100 | |||
| SNAP / Snap Inc. | 0.02 | 21.76 | 0.18 | -2.13 | 0.4700 | -0.0300 | |||
| NTNX / Nutanix, Inc. | 0.00 | -12.31 | 0.18 | -12.32 | 0.4500 | -0.0900 | |||
| ROK / Rockwell Automation, Inc. | 0.00 | -7.55 | 0.18 | 1.72 | 0.4500 | -0.0100 | |||
| DASH / DoorDash, Inc. | 0.00 | -43.81 | 0.18 | -40.80 | 0.4500 | -0.3500 | |||
| ACM / AECOM | 0.00 | 8.68 | 0.17 | 19.18 | 0.4400 | 0.0500 | |||
| FFIV / F5, Inc. | 0.00 | -2.56 | 0.17 | -4.92 | 0.4400 | -0.0500 | |||
| J / Jacobs Solutions Inc. | 0.00 | 9.67 | 0.17 | 8.13 | 0.4400 | 0.0100 | |||
| BBY / Best Buy Co., Inc. | 0.00 | 17.16 | 0.17 | -13.57 | 0.4400 | -0.0900 | |||
| JNPR / Juniper Networks, Inc. | 0.00 | 2.23 | 0.17 | 1.79 | 0.4300 | -0.0200 | |||
| EA / Electronic Arts Inc. | 0.00 | -21.30 | 0.17 | -12.31 | 0.4300 | -0.0900 | |||
| OKTA / Okta, Inc. | 0.00 | -21.38 | 0.17 | -10.58 | 0.4300 | -0.0700 | |||
| IP / International Paper Company | 0.00 | 16.71 | 0.17 | -1.17 | 0.4300 | -0.0200 | |||
| CIEN / Ciena Corporation | 0.00 | 6.73 | 0.17 | 7.01 | 0.4300 | 0.0100 | |||
| IQV / IQVIA Holdings Inc. | 0.00 | 29.77 | 0.17 | -4.00 | 0.4300 | -0.0300 | |||
| TRMB / Trimble Inc. | 0.00 | 4.91 | 0.17 | 3.73 | 0.4200 | -0.0100 | |||
| LYV / Live Nation Entertainment, Inc. | 0.00 | 4.66 | 0.17 | 0.00 | 0.4200 | -0.0200 | |||
| ZBRA / Zebra Technologies Corporation | 0.00 | 27.80 | 0.17 | 17.86 | 0.4200 | 0.0500 | |||
| DGX / Quest Diagnostics Incorporated | 0.00 | -8.02 | 0.17 | -7.30 | 0.4200 | -0.0500 | |||
| BAH / Booz Allen Hamilton Holding Corporation | 0.00 | 12.08 | 0.16 | 12.33 | 0.4200 | 0.0300 | |||
| DD / DuPont de Nemours, Inc. | 0.00 | 0.16 | 0.4100 | 0.4100 | |||||
| VTRS / Viatris Inc. | 0.02 | 12.77 | 0.16 | 7.38 | 0.4100 | 0.0100 | |||
| KD / Kyndryl Holdings, Inc. | 0.00 | 10.98 | 0.16 | 14.39 | 0.4000 | 0.0300 | |||
| TPR / Tapestry, Inc. | 0.00 | -6.95 | 0.16 | -14.67 | 0.4000 | -0.0900 | |||
| PPG / PPG Industries, Inc. | 0.00 | 0.16 | 0.3900 | 0.3900 | |||||
| ACI / Albertsons Companies, Inc. | 0.01 | 13.61 | 0.15 | 19.84 | 0.3800 | 0.0400 | |||
| DOW / Dow Inc. | 0.01 | 0.15 | 0.3800 | 0.3800 | |||||
| LUV / Southwest Airlines Co. | 0.00 | 2.88 | 0.15 | 11.19 | 0.3800 | 0.0200 | |||
| WBA / Walgreens Boots Alliance, Inc. | 0.01 | 0.81 | 0.15 | 5.71 | 0.3800 | 0.0100 | |||
| PEGA / Pegasystems Inc. | 0.00 | 10.73 | 0.15 | 38.68 | 0.3800 | 0.1000 | |||
| EXAS / Exact Sciences Corporation | 0.00 | 10.42 | 0.14 | 31.48 | 0.3600 | 0.0700 | |||
| CACI / CACI International Inc | 0.00 | -8.52 | 0.14 | 17.36 | 0.3600 | 0.0400 | |||
| TSN / Tyson Foods, Inc. | 0.00 | 0.14 | 0.3600 | 0.3600 | |||||
| DBX / Dropbox, Inc. | 0.00 | 0.79 | 0.14 | 12.00 | 0.3600 | 0.0300 | |||
| HAL / Halliburton Company | 0.01 | 39.48 | 0.14 | 3.73 | 0.3500 | -0.0100 | |||
| LYFT / Lyft, Inc. | 0.01 | 8.19 | 0.14 | 23.42 | 0.3500 | 0.0600 | |||
| JLL / Jones Lang LaSalle Incorporated | 0.00 | 12.20 | 0.14 | -8.05 | 0.3500 | -0.0500 | |||
| AAL / American Airlines Group Inc. | 0.01 | 24.90 | 0.14 | -0.73 | 0.3500 | -0.0100 | |||
| U / Unity Software Inc. | 0.01 | -5.84 | 0.13 | -4.29 | 0.3400 | -0.0300 | |||
| PSTG / Pure Storage, Inc. | 0.00 | 10.83 | 0.13 | 12.71 | 0.3400 | 0.0300 | |||
| W / Wayfair Inc. | 0.00 | 29.23 | 0.13 | 34.69 | 0.3400 | 0.0800 | |||
| ALLY / Ally Financial Inc. | 0.00 | 9.37 | 0.13 | 3.13 | 0.3400 | 0.0000 | |||
| HAS / Hasbro, Inc. | 0.00 | 1.12 | 0.13 | 3.94 | 0.3400 | 0.0000 | |||
| SWK / Stanley Black & Decker, Inc. | 0.00 | 32.18 | 0.13 | 0.00 | 0.3200 | -0.0200 | |||
| DVA / DaVita Inc. | 0.00 | 10.78 | 0.13 | 2.42 | 0.3200 | -0.0100 | |||
| ETSY / Etsy, Inc. | 0.00 | 6.82 | 0.13 | 15.60 | 0.3200 | 0.0300 | |||
| TXT / Textron Inc. | 0.00 | 15.49 | 0.13 | 14.68 | 0.3200 | 0.0300 | |||
| AKAM / Akamai Technologies, Inc. | 0.00 | 5.42 | 0.12 | -0.80 | 0.3100 | -0.0200 | |||
| PARA / Paramount Global | 0.01 | 3.42 | 0.12 | 9.82 | 0.3100 | 0.0100 | |||
| NWSA / News Corporation | 0.00 | -3.28 | 0.12 | -4.72 | 0.3100 | -0.0300 | |||
| SWKS / Skyworks Solutions, Inc. | 0.00 | 17.22 | 0.12 | 22.22 | 0.3100 | 0.0500 | |||
| GH / Guardant Health, Inc. | 0.00 | 0.12 | 0.3000 | 0.3000 | |||||
| JAZZ / Jazz Pharmaceuticals plc | 0.00 | 16.63 | 0.12 | -11.94 | 0.3000 | -0.0600 | |||
| EMN / Eastman Chemical Company | 0.00 | 20.39 | 0.12 | -3.31 | 0.3000 | -0.0200 | |||
| LRN / Stride, Inc. | 0.00 | -9.60 | 0.11 | 0.00 | 0.2900 | -0.0100 | |||
| TAP / Molson Coors Beverage Company | 0.00 | 1.31 | 0.11 | -11.11 | 0.2800 | -0.0600 | |||
| SAIC / Science Applications International Corporation | 0.00 | 1.80 | 0.11 | 19.35 | 0.2800 | 0.0300 | |||
| ARW / Arrow Electronics, Inc. | 0.00 | 0.11 | 0.2700 | 0.2700 | |||||
| D2OX34 / Amdocs Limited - Depositary Receipt (Common Stock) | 0.00 | 0.11 | 0.2700 | 0.2700 | |||||
| MAT / Mattel, Inc. | 0.01 | 3.53 | 0.11 | -7.83 | 0.2700 | -0.0400 | |||
| FLR / Fluor Corporation | 0.00 | 37.29 | 0.11 | 50.00 | 0.2700 | 0.0800 | |||
| URBN / Urban Outfitters, Inc. | 0.00 | 16.12 | 0.10 | 39.19 | 0.2600 | 0.0600 | |||
| QRVO / Qorvo, Inc. | 0.00 | 9.60 | 0.10 | 14.77 | 0.2600 | 0.0200 | |||
| MASI / Masimo Corporation | 0.00 | 13.04 | 0.10 | -2.88 | 0.2600 | -0.0200 | |||
| AGCO / AGCO Corporation | 0.00 | 7.90 | 0.10 | 8.99 | 0.2500 | 0.0100 | |||
| MTCH / Match Group, Inc. | 0.00 | 0.06 | 0.10 | -5.83 | 0.2500 | -0.0200 | |||
| G / Genpact Limited | 0.00 | -1.09 | 0.10 | -19.83 | 0.2500 | -0.0700 | |||
| BWA / BorgWarner Inc. | 0.00 | 8.12 | 0.09 | 19.48 | 0.2400 | 0.0300 | |||
| BIO / Bio-Rad Laboratories, Inc. | 0.00 | 25.23 | 0.09 | 6.98 | 0.2300 | 0.0000 | |||
| PATH / UiPath Inc. | 0.01 | -0.18 | 0.09 | 7.14 | 0.2300 | 0.0100 | |||
| WHR / Whirlpool Corporation | 0.00 | 29.37 | 0.09 | 0.00 | 0.2300 | -0.0100 | |||
| ALK / Alaska Air Group, Inc. | 0.00 | 26.00 | 0.09 | -11.22 | 0.2200 | -0.0400 | |||
| GAP / The Gap, Inc. | 0.00 | 1.15 | 0.09 | 0.00 | 0.2200 | -0.0100 | |||
| ANF / Abercrombie & Fitch Co. | 0.00 | 27.78 | 0.09 | -2.30 | 0.2200 | -0.0100 | |||
| SIRI / Sirius XM Holdings Inc. | 0.00 | 1.03 | 0.09 | -9.57 | 0.2200 | -0.0300 | |||
| NOV / NOV Inc. | 0.01 | 22.70 | 0.08 | -1.18 | 0.2100 | -0.0200 | |||
| FMC / FMC Corporation | 0.00 | 0.08 | 0.2100 | 0.2100 | |||||
| IVZ / Invesco Ltd. | 0.01 | 10.04 | 0.08 | -11.96 | 0.2100 | -0.0400 | |||
| FLS / Flowserve Corporation | 0.00 | 9.75 | 0.08 | -1.25 | 0.2000 | -0.0100 | |||
| RHI / Robert Half Inc. | 0.00 | 39.44 | 0.08 | 8.22 | 0.2000 | 0.0000 | |||
| AMTM / Amentum Holdings, Inc. | 0.00 | 0.00 | 0.0000 | 0.0000 | |||||
| ZS / Zscaler, Inc. | 0.00 | -100.00 | 0.00 | -100.00 | -0.5000 | ||||
| ELAN / Elanco Animal Health Incorporated | 0.00 | -100.00 | 0.00 | -100.00 | -0.2500 | ||||
| META / Meta Platforms, Inc. | 0.00 | -100.00 | 0.00 | -100.00 | -0.4000 | ||||
| PANW / Palo Alto Networks, Inc. | 0.00 | -100.00 | 0.00 | -100.00 | -0.8800 | ||||
| TRU / TransUnion | 0.00 | -100.00 | 0.00 | -100.00 | -0.3300 | ||||
| M / Macy's, Inc. | 0.00 | -100.00 | 0.00 | -100.00 | -0.1600 | ||||
| RIVN / Rivian Automotive, Inc. | 0.00 | -100.00 | 0.00 | -100.00 | -0.2800 | ||||
| LUMN / Lumen Technologies, Inc. | 0.00 | -100.00 | 0.00 | -100.00 | -0.2700 |