Basic Stats
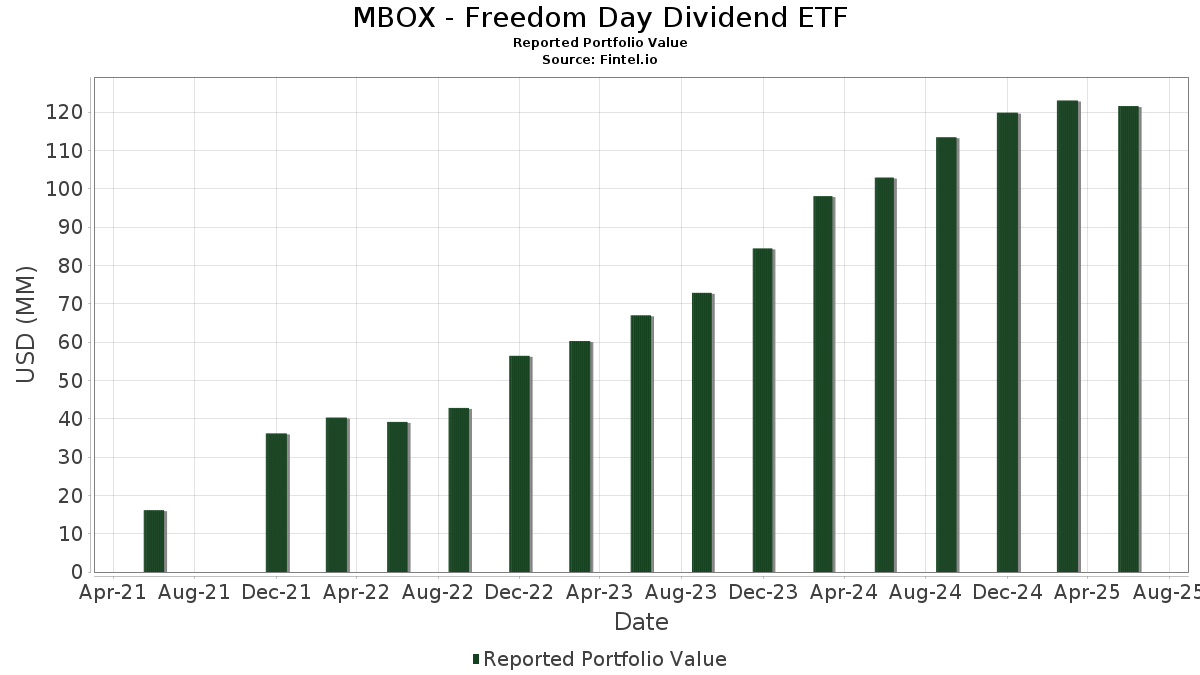
| Portfolio Value | $ 121,563,129 |
| Current Positions | 50 |
Latest Holdings, Performance, AUM (from 13F, 13D)
MBOX - Freedom Day Dividend ETF has disclosed 50 total holdings in their latest SEC filings. Most recent portfolio value is calculated to be $ 121,563,129 USD. Actual Assets Under Management (AUM) is this value plus cash (which is not disclosed). MBOX - Freedom Day Dividend ETF’s top holdings are Broadcom Inc. (US:AVGO) , JPMorgan Chase & Co. (US:JPM) , KLA Corporation (US:KLAC) , Morgan Stanley (US:MS) , and Energy Transfer LP - Limited Partnership (US:ET) . MBOX - Freedom Day Dividend ETF’s new positions include Novartis AG - Depositary Receipt (Common Stock) (US:NVS) , Voya Financial, Inc. (US:VOYA) , QUALCOMM Incorporated (US:QCOM) , Exxon Mobil Corporation (US:XOM) , and Lamar Advertising Company (US:LAMR) .
Top Increases This Quarter
We use the change in the portfolio allocation because this is the most meaningful metric. Changes can be due to trades or changes in share prices.
| Security | Shares (MM) |
Value (MM$) |
Portfolio % | ΔPortfolio % |
|---|---|---|---|---|
| 0.02 | 2.54 | 2.1000 | 2.1000 | |
| 0.04 | 2.53 | 2.0900 | 2.0900 | |
| 0.02 | 2.53 | 2.0900 | 2.0900 | |
| 0.02 | 2.49 | 2.0500 | 2.0500 | |
| 0.02 | 2.39 | 1.9700 | 1.9700 | |
| 0.02 | 1.92 | 1.5900 | 1.5900 | |
| 0.04 | 1.85 | 1.5300 | 1.5300 | |
| 0.01 | 3.62 | 2.9900 | 1.1500 | |
| 0.00 | 2.58 | 2.1300 | 0.7000 | |
| 0.00 | 3.26 | 2.6900 | 0.6200 |
Top Decreases This Quarter
We use the change in the portfolio allocation because this is the most meaningful metric. Changes can be due to trades or changes in share prices.
| Security | Shares (MM) |
Value (MM$) |
Portfolio % | ΔPortfolio % |
|---|---|---|---|---|
| 0.04 | 1.89 | 1.5600 | -0.4400 | |
| 0.59 | 0.4800 | -0.3600 | ||
| 0.04 | 2.32 | 1.9200 | -0.3300 | |
| 0.01 | 2.21 | 1.8300 | -0.3000 | |
| 0.02 | 2.71 | 2.2400 | -0.2900 | |
| 0.02 | 2.57 | 2.1200 | -0.2900 | |
| 0.01 | 2.23 | 1.8400 | -0.2400 | |
| 0.03 | 1.98 | 1.6400 | -0.2400 | |
| 0.01 | 2.89 | 2.3900 | -0.2100 | |
| 0.02 | 1.95 | 1.6100 | -0.1300 |
13F and Fund Filings
This form was filed on 2025-08-29 for the reporting period 2025-06-30. Click the link icon to see the full transaction history.
Upgrade to unlock premium data and export to Excel ![]() .
.
| Security | Type | Avg Share Price | Shares (MM) |
ΔShares (%) |
ΔShares (%) |
Value ($MM) |
Portfolio (%) |
ΔPortfolio (%) |
|
|---|---|---|---|---|---|---|---|---|---|
| AVGO / Broadcom Inc. | 0.01 | -2.41 | 3.62 | 60.69 | 2.9900 | 1.1500 | |||
| JPM / JPMorgan Chase & Co. | 0.01 | -2.37 | 3.55 | 15.39 | 2.9300 | 0.4200 | |||
| KLAC / KLA Corporation | 0.00 | -2.41 | 3.26 | 28.59 | 2.6900 | 0.6200 | |||
| MS / Morgan Stanley | 0.02 | -2.40 | 3.09 | 17.87 | 2.5500 | 0.4100 | |||
| ET / Energy Transfer LP - Limited Partnership | 0.16 | 5.60 | 2.98 | 3.00 | 2.4600 | 0.1000 | |||
| RSG / Republic Services, Inc. | 0.01 | -3.20 | 2.95 | -1.40 | 2.4400 | 0.0000 | |||
| PGR / The Progressive Corporation | 0.01 | -3.64 | 2.89 | -9.11 | 2.3900 | -0.2100 | |||
| DE / Deere & Company | 0.01 | -2.58 | 2.88 | 5.54 | 2.3700 | 0.1500 | |||
| KR / The Kroger Co. | 0.04 | -2.42 | 2.83 | 3.40 | 2.3400 | 0.1100 | |||
| EPD / Enterprise Products Partners L.P. - Limited Partnership | 0.09 | 3.61 | 2.83 | -5.92 | 2.3400 | -0.1100 | |||
| MSFT / Microsoft Corporation | 0.01 | -2.36 | 2.78 | 29.42 | 2.2900 | 0.5400 | |||
| CINF / Cincinnati Financial Corporation | 0.02 | -3.29 | 2.74 | -2.49 | 2.2600 | -0.0300 | |||
| AEM / Agnico Eagle Mines Limited | 0.02 | -20.43 | 2.71 | -12.69 | 2.2400 | -0.2900 | |||
| TRV / The Travelers Companies, Inc. | 0.01 | -2.40 | 2.64 | -1.24 | 2.1800 | 0.0000 | |||
| OZK / Bank OZK | 0.05 | -2.43 | 2.58 | 5.69 | 2.1300 | 0.1300 | |||
| ASML / ASML Holding N.V. | 0.00 | 21.24 | 2.58 | 46.64 | 2.1300 | 0.7000 | |||
| EOG / EOG Resources, Inc. | 0.02 | -6.90 | 2.57 | -13.20 | 2.1200 | -0.2900 | |||
| NVS / Novartis AG - Depositary Receipt (Common Stock) | 0.02 | 2.54 | 2.1000 | 2.1000 | |||||
| VOYA / Voya Financial, Inc. | 0.04 | 2.53 | 2.0900 | 2.0900 | |||||
| QCOM / QUALCOMM Incorporated | 0.02 | 2.53 | 2.0900 | 2.0900 | |||||
| CI / The Cigna Group | 0.01 | -2.42 | 2.52 | -1.95 | 2.0800 | -0.0100 | |||
| XOM / Exxon Mobil Corporation | 0.02 | 2.49 | 2.0500 | 2.0500 | |||||
| HRB / H&R Block, Inc. | 0.04 | -2.43 | 2.42 | -2.46 | 2.0000 | -0.0200 | |||
| HD / The Home Depot, Inc. | 0.01 | -2.41 | 2.41 | -2.39 | 1.9900 | -0.0200 | |||
| DKS / DICK'S Sporting Goods, Inc. | 0.01 | -2.38 | 2.41 | -4.18 | 1.9900 | -0.0600 | |||
| TSCO / Tractor Supply Company | 0.05 | -2.43 | 2.40 | -6.53 | 1.9800 | -0.1200 | |||
| MLI / Mueller Industries, Inc. | 0.03 | -2.42 | 2.40 | 1.83 | 1.9800 | 0.0600 | |||
| LAMR / Lamar Advertising Company | 0.02 | 2.39 | 1.9700 | 1.9700 | |||||
| NXST / Nexstar Media Group, Inc. | 0.01 | -2.38 | 2.36 | -5.79 | 1.9500 | -0.0900 | |||
| ACN / Accenture plc | 0.01 | -2.35 | 2.35 | -6.45 | 1.9400 | -0.1100 | |||
| CF / CF Industries Holdings, Inc. | 0.03 | -2.43 | 2.33 | 14.90 | 1.9200 | 0.2700 | |||
| GRMN / Garmin Ltd. | 0.01 | -2.37 | 2.33 | -6.17 | 1.9200 | -0.1000 | |||
| FNF / Fidelity National Financial, Inc. | 0.04 | -2.42 | 2.32 | -15.94 | 1.9200 | -0.3300 | |||
| CNQ / Canadian Natural Resources Limited | 0.07 | -2.43 | 2.32 | -0.52 | 1.9100 | 0.0100 | |||
| INGR / Ingredion Incorporated | 0.02 | 6.33 | 2.32 | 6.68 | 1.9100 | 0.1400 | |||
| AMGN / Amgen Inc. | 0.01 | -2.42 | 2.23 | -12.57 | 1.8400 | -0.2400 | |||
| WSO / Watsco, Inc. | 0.01 | -2.28 | 2.21 | -15.12 | 1.8300 | -0.3000 | |||
| MDLZ / Mondelez International, Inc. | 0.03 | -2.43 | 2.14 | -3.03 | 1.7700 | -0.0300 | |||
| MPC / Marathon Petroleum Corporation | 0.01 | -2.39 | 2.14 | 11.28 | 1.7700 | 0.2000 | |||
| HSY / The Hershey Company | 0.01 | 6.62 | 2.13 | 3.45 | 1.7600 | 0.0800 | |||
| VICI / VICI Properties Inc. | 0.06 | -2.42 | 2.09 | -2.47 | 1.7300 | -0.0200 | |||
| MRK / Merck & Co., Inc. | 0.03 | -2.42 | 1.98 | -13.94 | 1.6400 | -0.2400 | |||
| PLD / Prologis, Inc. | 0.02 | -2.41 | 1.95 | -8.23 | 1.6100 | -0.1300 | |||
| WSM / Williams-Sonoma, Inc. | 0.01 | -2.43 | 1.95 | 0.83 | 1.6100 | 0.0300 | |||
| RHP / Ryman Hospitality Properties, Inc. | 0.02 | 1.92 | 1.5900 | 1.5900 | |||||
| TAP / Molson Coors Beverage Company | 0.04 | -2.41 | 1.89 | -22.89 | 1.5600 | -0.4400 | |||
| EIX / Edison International | 0.04 | 1.85 | 1.5300 | 1.5300 | |||||
| NVO / Novo Nordisk A/S - Depositary Receipt (Common Stock) | 0.03 | 13.33 | 1.84 | 12.61 | 1.5200 | 0.1900 | |||
| OC / Owens Corning | 0.01 | -2.41 | 1.80 | -6.05 | 1.4900 | -0.0700 | |||
| FGXXX / First American Funds Inc - First American Government Obligations Fund Class X | 0.59 | -43.15 | 0.4800 | -0.3600 |