Basic Stats
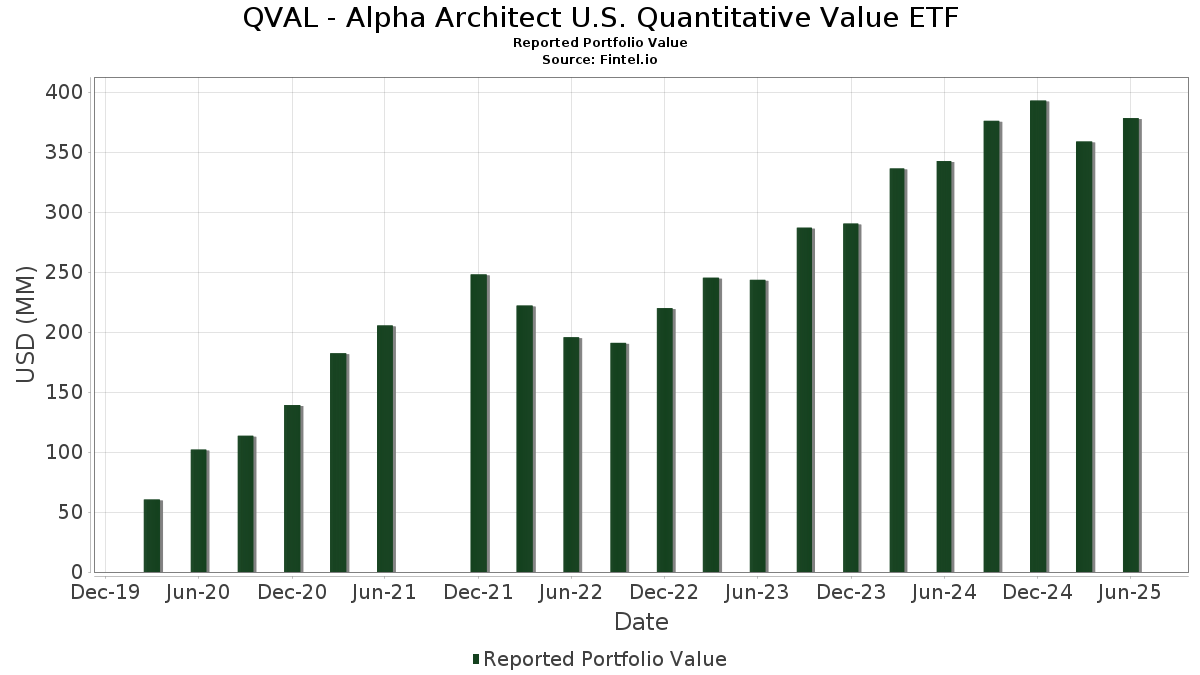
| Portfolio Value | $ 378,298,056 |
| Current Positions | 51 |
Latest Holdings, Performance, AUM (from 13F, 13D)
QVAL - Alpha Architect U.S. Quantitative Value ETF has disclosed 51 total holdings in their latest SEC filings. Most recent portfolio value is calculated to be $ 378,298,056 USD. Actual Assets Under Management (AUM) is this value plus cash (which is not disclosed). QVAL - Alpha Architect U.S. Quantitative Value ETF’s top holdings are Southern Copper Corporation (US:SCCO) , DICK'S Sporting Goods, Inc. (US:DKS) , TechnipFMC plc (US:FTI) , WESCO International, Inc. (US:WCC) , and Newmont Corporation (US:NEM) . QVAL - Alpha Architect U.S. Quantitative Value ETF’s new positions include Southern Copper Corporation (US:SCCO) , WESCO International, Inc. (US:WCC) , Baker Hughes Company (US:BKR) , NVR, Inc. (US:NVR) , and The Cigna Group (US:CI) .
Top Increases This Quarter
We use the change in the portfolio allocation because this is the most meaningful metric. Changes can be due to trades or changes in share prices.
| Security | Shares (MM) |
Value (MM$) |
Portfolio % | ΔPortfolio % |
|---|---|---|---|---|
| 0.08 | 8.34 | 2.2000 | 2.2000 | |
| 0.04 | 8.26 | 2.1800 | 2.1800 | |
| 0.04 | 8.18 | 2.1600 | 2.1600 | |
| 0.10 | 8.08 | 2.1300 | 2.1300 | |
| 0.05 | 7.75 | 2.0500 | 2.0500 | |
| 0.20 | 7.74 | 2.0400 | 2.0400 | |
| 0.00 | 7.73 | 2.0400 | 2.0400 | |
| 0.02 | 7.73 | 2.0400 | 2.0400 | |
| 0.17 | 7.71 | 2.0400 | 2.0400 | |
| 0.12 | 7.67 | 2.0300 | 2.0300 |
Top Decreases This Quarter
We use the change in the portfolio allocation because this is the most meaningful metric. Changes can be due to trades or changes in share prices.
| Security | Shares (MM) |
Value (MM$) |
Portfolio % | ΔPortfolio % |
|---|---|---|---|---|
| 0.00 | 0.00 | -2.0000 | ||
| 0.00 | 0.00 | -1.9900 | ||
| 0.00 | 0.00 | -1.9800 | ||
| 0.00 | 0.00 | -1.9600 | ||
| 0.00 | 0.00 | -1.9600 | ||
| 0.00 | 0.00 | -1.9500 | ||
| 0.00 | 0.00 | -1.9500 | ||
| 0.00 | 0.00 | -1.9500 | ||
| 0.02 | 6.71 | 1.7700 | -0.2300 | |
| 0.07 | 6.81 | 1.8000 | -0.1700 |
13F and Fund Filings
This form was filed on 2025-08-29 for the reporting period 2025-06-30. Click the link icon to see the full transaction history.
Upgrade to unlock premium data and export to Excel ![]() .
.
| Security | Type | Avg Share Price | Shares (MM) |
ΔShares (%) |
ΔShares (%) |
Value ($MM) |
Portfolio (%) |
ΔPortfolio (%) |
|
|---|---|---|---|---|---|---|---|---|---|
| SCCO / Southern Copper Corporation | 0.08 | 8.34 | 2.2000 | 2.2000 | |||||
| DKS / DICK'S Sporting Goods, Inc. | 0.04 | 8.26 | 2.1800 | 2.1800 | |||||
| FTI / TechnipFMC plc | 0.24 | 4.08 | 8.24 | 13.12 | 2.1800 | 0.1500 | |||
| WCC / WESCO International, Inc. | 0.04 | 8.18 | 2.1600 | 2.1600 | |||||
| NEM / Newmont Corporation | 0.14 | -5.68 | 8.10 | 13.81 | 2.1400 | 0.1600 | |||
| LNTH / Lantheus Holdings, Inc. | 0.10 | 8.08 | 2.1300 | 2.1300 | |||||
| PR / Permian Resources Corporation | 0.59 | 12.28 | 7.99 | 10.42 | 2.1100 | 0.0900 | |||
| LDOS / Leidos Holdings, Inc. | 0.05 | -4.61 | 7.96 | 11.51 | 2.1000 | 0.1100 | |||
| LAD / Lithia Motors, Inc. | 0.02 | -4.72 | 7.94 | 9.65 | 2.1000 | 0.0800 | |||
| CRUS / Cirrus Logic, Inc. | 0.08 | 6.67 | 7.92 | 11.59 | 2.0900 | 0.1100 | |||
| HES / Hess Corporation | 0.06 | 25.61 | 7.81 | 8.94 | 2.0600 | 0.0600 | |||
| CCK / Crown Holdings, Inc. | 0.08 | -6.87 | 7.79 | 7.45 | 2.0600 | 0.0400 | |||
| DVA / DaVita Inc. | 0.05 | 7.75 | 2.0500 | 2.0500 | |||||
| BKR / Baker Hughes Company | 0.20 | 7.74 | 2.0400 | 2.0400 | |||||
| NVR / NVR, Inc. | 0.00 | 7.73 | 2.0400 | 2.0400 | |||||
| CI / The Cigna Group | 0.02 | 7.73 | 2.0400 | 2.0400 | |||||
| EXEL / Exelixis, Inc. | 0.17 | 7.71 | 2.0400 | 2.0400 | |||||
| CALM / Cal-Maine Foods, Inc. | 0.08 | -1.04 | 7.70 | 8.46 | 2.0300 | 0.0500 | |||
| CMCSA / Comcast Corporation | 0.22 | 11.46 | 7.69 | 7.81 | 2.0300 | 0.0400 | |||
| MAS / Masco Corporation | 0.12 | 7.67 | 2.0300 | 2.0300 | |||||
| NOV / NOV Inc. | 0.62 | 29.38 | 7.67 | 5.67 | 2.0300 | 0.0100 | |||
| YETI / YETI Holdings, Inc. | 0.24 | 12.16 | 7.62 | 6.81 | 2.0100 | 0.0200 | |||
| FOXA / Fox Corporation | 0.14 | 4.13 | 7.61 | 3.10 | 2.0100 | -0.0500 | |||
| MRK / Merck & Co., Inc. | 0.10 | 20.91 | 7.61 | 6.64 | 2.0100 | 0.0200 | |||
| ADT / ADT Inc. | 0.90 | 1.88 | 7.60 | 6.01 | 2.0100 | 0.0100 | |||
| SLB / Schlumberger Limited | 0.22 | 32.45 | 7.60 | 7.11 | 2.0100 | 0.0300 | |||
| NXST / Nexstar Media Group, Inc. | 0.04 | 7.67 | 7.57 | 3.90 | 2.0000 | -0.0300 | |||
| CF / CF Industries Holdings, Inc. | 0.08 | 7.54 | 1.9900 | 1.9900 | |||||
| EXPD / Expeditors International of Washington, Inc. | 0.07 | 7.52 | 1.9900 | 1.9900 | |||||
| CMI / Cummins Inc. | 0.02 | 7.52 | 1.9900 | 1.9900 | |||||
| URBN / Urban Outfitters, Inc. | 0.10 | -26.62 | 7.50 | 1.60 | 1.9800 | -0.0800 | |||
| UAL / United Airlines Holdings, Inc. | 0.09 | -7.71 | 7.49 | 6.44 | 1.9800 | 0.0200 | |||
| ELV / Elevance Health, Inc. | 0.02 | 7.42 | 1.9600 | 1.9600 | |||||
| GM / General Motors Company | 0.15 | 7.34 | 1.9400 | 1.9400 | |||||
| BAH / Booz Allen Hamilton Holding Corporation | 0.07 | 4.04 | 7.32 | 3.59 | 1.9300 | -0.0400 | |||
| VZ / Verizon Communications Inc. | 0.17 | 6.59 | 7.29 | 1.67 | 1.9300 | -0.0700 | |||
| INGR / Ingredion Incorporated | 0.05 | 0.93 | 7.24 | 1.23 | 1.9100 | -0.0800 | |||
| SNA / Snap-on Incorporated | 0.02 | 7.71 | 7.24 | -0.55 | 1.9100 | -0.1200 | |||
| CTSH / Cognizant Technology Solutions Corporation | 0.09 | 7.23 | 1.9100 | 1.9100 | |||||
| MO / Altria Group, Inc. | 0.12 | 0.08 | 7.21 | -2.24 | 1.9100 | -0.1500 | |||
| MOH / Molina Healthcare, Inc. | 0.02 | 7.19 | 1.9000 | 1.9000 | |||||
| MMS / Maximus, Inc. | 0.10 | -2.45 | 7.19 | 0.42 | 1.9000 | -0.1000 | |||
| GAP / The Gap, Inc. | 0.33 | -7.42 | 7.09 | -2.02 | 1.8700 | -0.1500 | |||
| NXT / Nextracker Inc. | 0.13 | -21.52 | 7.08 | 1.26 | 1.8700 | -0.0800 | |||
| CNC / Centene Corporation | 0.13 | 7.08 | 1.8700 | 1.8700 | |||||
| EMN / Eastman Chemical Company | 0.09 | 15.30 | 7.06 | -2.30 | 1.8600 | -0.1500 | |||
| UHS / Universal Health Services, Inc. | 0.04 | 1.79 | 7.03 | -1.87 | 1.8600 | -0.1400 | |||
| HALO / Halozyme Therapeutics, Inc. | 0.13 | 6.96 | 1.8400 | 1.8400 | |||||
| ALSN / Allison Transmission Holdings, Inc. | 0.07 | -3.11 | 6.81 | -3.80 | 1.8000 | -0.1700 | |||
| UTHR / United Therapeutics Corporation | 0.02 | 0.31 | 6.71 | -6.49 | 1.7700 | -0.2300 | |||
| FGXXX / First American Funds Inc - First American Government Obligations Fund Class X | 0.63 | 112.88 | 0.1700 | 0.0900 | |||||
| M / Macy's, Inc. | 0.00 | -100.00 | 0.00 | -100.00 | -1.9500 | ||||
| HSY / The Hershey Company | 0.00 | -100.00 | 0.00 | -100.00 | -2.0000 | ||||
| FSLR / First Solar, Inc. | 0.00 | -100.00 | 0.00 | -100.00 | -1.9500 | ||||
| CAT / Caterpillar Inc. | 0.00 | -100.00 | 0.00 | -100.00 | -1.9900 | ||||
| FSLR / First Solar, Inc. | 0.00 | -100.00 | 0.00 | -100.00 | -1.9500 | ||||
| 1WDC / Western Digital Corporation | 0.00 | -100.00 | 0.00 | -100.00 | -1.9600 | ||||
| 1WDC / Western Digital Corporation | 0.00 | -100.00 | 0.00 | -100.00 | -1.9600 | ||||
| EME / EMCOR Group, Inc. | 0.00 | -100.00 | 0.00 | -100.00 | -1.9800 |