Basic Stats
| Insider Profile | ALLEN OPERATIONS LLC |
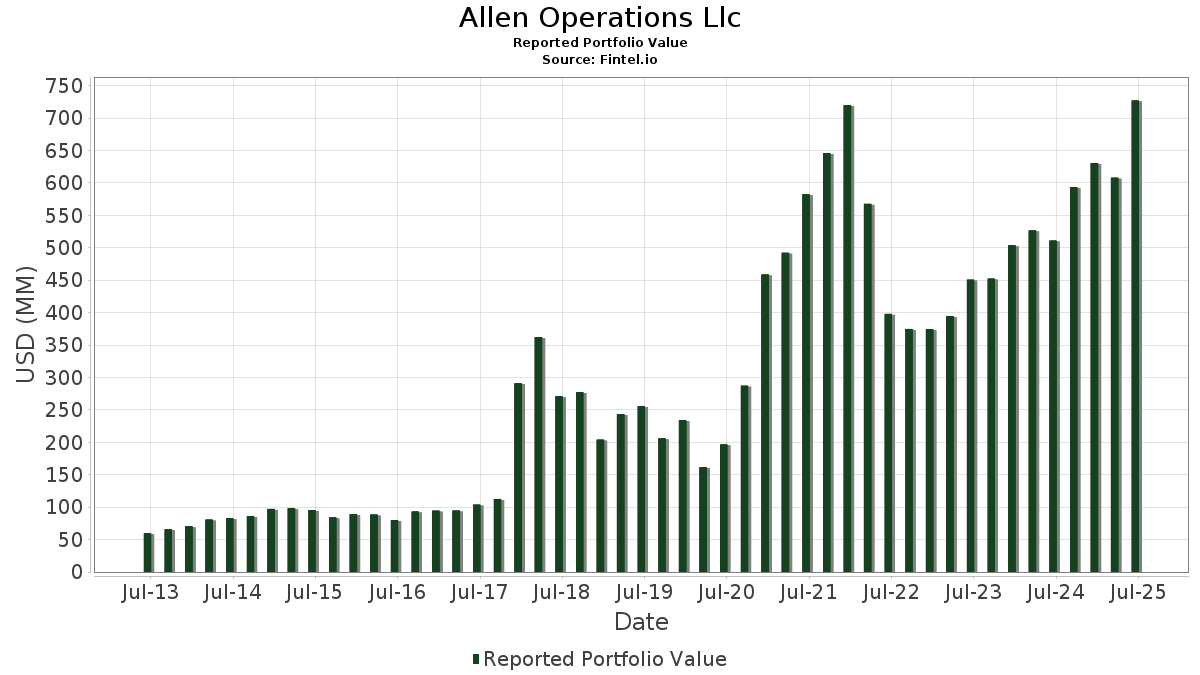
| Portfolio Value | $ 727,005,529 |
| Current Positions | 34 |
Latest Holdings, Performance, AUM (from 13F, 13D)
Allen Operations Llc has disclosed 34 total holdings in their latest SEC filings. Most recent portfolio value is calculated to be $ 727,005,529 USD. Actual Assets Under Management (AUM) is this value plus cash (which is not disclosed). Allen Operations Llc’s top holdings are Palantir Technologies Inc. (US:PLTR) , Acuity Inc. (US:AYI) , Aurora Innovation, Inc. (US:AUR) , Affirm Holdings, Inc. (US:AFRM) , and Microsoft Corporation (US:MSFT) . Allen Operations Llc’s new positions include GE Vernova Inc. (US:GEV) , UnitedHealth Group Incorporated (US:UNH) , Samsara Inc. (US:IOT) , .
Top Increases This Quarter
We use the change in the portfolio allocation because this is the most meaningful metric. Changes can be due to trades or changes in share prices.
| Security | Shares (MM) |
Value (MM$) |
Portfolio % | ΔPortfolio % |
|---|---|---|---|---|
| 1.20 | 163.58 | 22.0416 | 5.3822 | |
| 0.72 | 49.88 | 6.7204 | 1.3582 | |
| 0.01 | 5.01 | 0.6745 | 0.6745 | |
| 1.56 | 16.44 | 2.2146 | 0.6719 | |
| 0.01 | 4.44 | 0.6104 | 0.6104 | |
| 0.09 | 43.96 | 6.0471 | 0.5895 | |
| 0.01 | 4.25 | 0.5850 | 0.5850 | |
| 0.67 | 41.02 | 5.5275 | 0.3672 | |
| 0.17 | 2.56 | 0.3521 | 0.3521 | |
| 0.33 | 9.74 | 1.3120 | 0.1396 |
Top Decreases This Quarter
We use the change in the portfolio allocation because this is the most meaningful metric. Changes can be due to trades or changes in share prices.
| Security | Shares (MM) |
Value (MM$) |
Portfolio % | ΔPortfolio % |
|---|---|---|---|---|
| 10.39 | 54.42 | 7.3324 | -4.1555 | |
| 0.09 | 15.16 | 2.0848 | -1.9529 | |
| 0.00 | 29.88 | 4.0262 | -1.3585 | |
| 0.34 | 102.66 | 13.8324 | -1.0733 | |
| 0.07 | 36.84 | 5.0669 | -0.8433 | |
| 0.32 | 11.93 | 1.6409 | -0.7733 | |
| 0.11 | 26.88 | 3.6971 | -0.6048 | |
| 0.09 | 9.69 | 1.3058 | -0.4529 | |
| 0.44 | 40.15 | 5.4105 | -0.2563 | |
| 0.49 | 13.62 | 1.8351 | -0.2558 |
13F and Fund Filings
This form was filed on 2025-08-07 for the reporting period 2025-06-30. Click the link icon to see the full transaction history.
Upgrade to unlock premium data and export to Excel ![]() .
.
| Security | Type | Avg Share Price | Shares (MM) |
ΔShares (%) |
ΔShares (%) |
Value ($MM) |
Portfolio (%) |
ΔPortfolio (%) |
|
|---|---|---|---|---|---|---|---|---|---|
| PLTR / Palantir Technologies Inc. | 1.20 | 0.00 | 163.58 | 61.52 | 22.0416 | 5.3822 | |||
| AYI / Acuity Inc. | 0.34 | 0.00 | 102.66 | 13.29 | 13.8324 | -1.0733 | |||
| AUR / Aurora Innovation, Inc. | 10.39 | 0.00 | 54.42 | -22.08 | 7.3324 | -4.1555 | |||
| AFRM / Affirm Holdings, Inc. | 0.72 | 0.00 | 49.88 | 53.00 | 6.7204 | 1.3582 | |||
| MSFT / Microsoft Corporation | 0.09 | 0.00 | 43.96 | 32.50 | 6.0471 | 0.5895 | |||
| IBIT / iShares Bitcoin Trust ETF | 0.67 | 0.00 | 41.02 | 30.76 | 5.5275 | 0.3672 | |||
| SCHW / The Charles Schwab Corporation | 0.44 | 0.00 | 40.15 | 16.56 | 5.4105 | -0.2563 | |||
| MA / Mastercard Incorporated | 0.07 | 0.00 | 36.84 | 2.52 | 5.0669 | -0.8433 | |||
| BRK.A / Berkshire Hathaway Inc. | 0.00 | 0.00 | 29.88 | -8.72 | 4.0262 | -1.3585 | |||
| WDAY / Workday, Inc. | 0.11 | 0.00 | 26.88 | 2.77 | 3.6971 | -0.6048 | |||
| JOBY / Joby Aviation, Inc. | 1.56 | 0.00 | 16.44 | 75.25 | 2.2146 | 0.6719 | |||
| GOOG / Alphabet Inc. | 0.09 | -45.62 | 15.16 | -38.26 | 2.0848 | -1.9529 | |||
| GOOGL / Alphabet Inc. | 0.08 | 0.00 | 14.69 | 13.97 | 1.9799 | -0.1410 | |||
| YOU / Clear Secure, Inc. | 0.49 | 0.00 | 13.62 | 7.14 | 1.8351 | -0.2558 | |||
| IAC / IAC Inc. | 0.32 | 0.00 | 11.93 | -18.72 | 1.6409 | -0.7733 | |||
| CPNG / Coupang, Inc. | 0.33 | 0.00 | 9.74 | 36.62 | 1.3120 | 0.1396 | |||
| XOM / Exxon Mobil Corporation | 0.09 | 0.00 | 9.69 | -9.35 | 1.3058 | -0.4529 | |||
| KO / The Coca-Cola Company | 0.10 | 0.00 | 7.01 | -1.21 | 0.9640 | -0.2030 | |||
| META / Meta Platforms, Inc. | 0.01 | 5.01 | 0.6745 | 0.6745 | |||||
| TEM / Tempus AI, Inc. | 0.08 | 0.00 | 4.87 | 31.71 | 0.6560 | 0.0480 | |||
| GEV / GE Vernova Inc. | 0.01 | 4.44 | 0.6104 | 0.6104 | |||||
| UNH / UnitedHealth Group Incorporated | 0.01 | 4.25 | 0.5850 | 0.5850 | |||||
| TDG / TransDigm Group Incorporated | 0.00 | 0.00 | 4.20 | 9.94 | 0.5663 | -0.0626 | |||
| V / Visa Inc. | 0.01 | 0.00 | 4.14 | 1.30 | 0.5582 | -0.1144 | |||
| BRK.B / Berkshire Hathaway Inc. | 0.01 | 0.00 | 3.35 | -8.78 | 0.4520 | -0.1530 | |||
| ANGI / Angi Inc. | 0.17 | 2.56 | 0.3521 | 0.3521 | |||||
| BLND / Blend Labs, Inc. | 0.34 | 0.00 | 1.14 | -1.47 | 0.1533 | -0.0367 | |||
| ALAB / Astera Labs, Inc. | 0.01 | 0.00 | 1.11 | 51.64 | 0.1492 | 0.0290 | |||
| RXRX / Recursion Pharmaceuticals, Inc. | 0.22 | 0.00 | 1.10 | -4.34 | 0.1484 | -0.0410 | |||
| IOT / Samsara Inc. | 0.02 | 0.94 | 0.1287 | 0.1287 | |||||
| DNA / Ginkgo Bioworks Holdings, Inc. | 0.06 | 0.00 | 0.70 | 97.17 | 0.0939 | 0.0358 | |||
| ABSI / Absci Corporation | 0.24 | 0.00 | 0.61 | 2.36 | 0.0818 | -0.0157 | |||
| VMEO / Vimeo, Inc. | 0.14 | 0.00 | 0.56 | -23.30 | 0.0776 | -0.0432 | |||
| DIBS / 1stdibs.Com, Inc. | 0.18 | 0.00 | 0.49 | -9.50 | 0.0669 | -0.0215 | |||
| BSLK / Bolt Projects Holdings, Inc. | 0.00 | -100.00 | 0.00 | 0.0000 |