Basic Stats
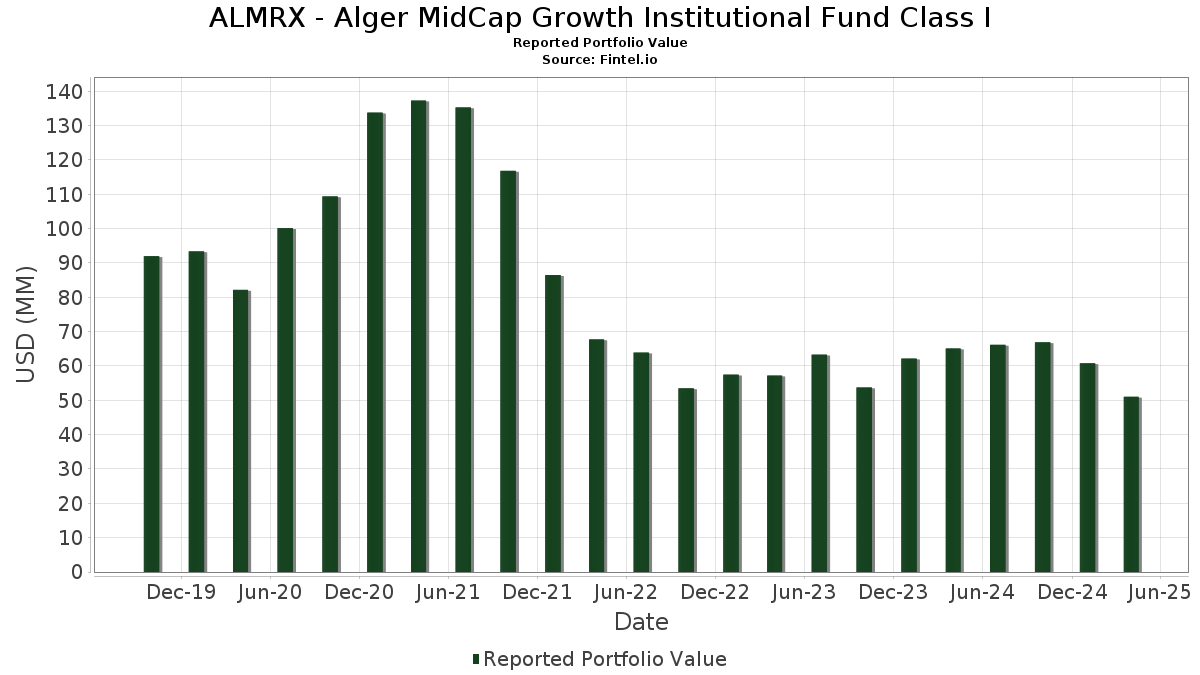
| Portfolio Value | $ 51,026,451 |
| Current Positions | 60 |
Latest Holdings, Performance, AUM (from 13F, 13D)
ALMRX - Alger MidCap Growth Institutional Fund Class I has disclosed 60 total holdings in their latest SEC filings. Most recent portfolio value is calculated to be $ 51,026,451 USD. Actual Assets Under Management (AUM) is this value plus cash (which is not disclosed). ALMRX - Alger MidCap Growth Institutional Fund Class I’s top holdings are GFL Environmental Inc. (US:GFL) , Palantir Technologies Inc. (US:PLTR) , Constellation Software Inc. (CA:CSU) , Talen Energy Corporation (US:TLN) , and Blue Owl Capital Inc. (US:OWL) . ALMRX - Alger MidCap Growth Institutional Fund Class I’s new positions include CONSTELLATION SOFTWARE INC (CA:CA21037X1345) , .
Top Increases This Quarter
We use the change in the portfolio allocation because this is the most meaningful metric. Changes can be due to trades or changes in share prices.
| Security | Shares (MM) |
Value (MM$) |
Portfolio % | ΔPortfolio % |
|---|---|---|---|---|
| 1.43 | 1.43 | 2.8280 | 2.5878 | |
| 0.06 | 2.92 | 5.7795 | 1.8331 | |
| 0.02 | 2.40 | 4.7455 | 1.6967 | |
| 0.00 | 2.28 | 4.5157 | 1.3813 | |
| 0.00 | 1.21 | 2.4001 | 1.3769 | |
| 0.02 | 0.80 | 1.5789 | 1.3174 | |
| 0.00 | 0.94 | 1.8636 | 1.0324 | |
| 0.01 | 1.38 | 2.7285 | 1.0249 | |
| 0.01 | 1.08 | 2.1374 | 0.9983 | |
| 0.01 | 1.12 | 2.2135 | 0.9425 |
Top Decreases This Quarter
We use the change in the portfolio allocation because this is the most meaningful metric. Changes can be due to trades or changes in share prices.
| Security | Shares (MM) |
Value (MM$) |
Portfolio % | ΔPortfolio % |
|---|---|---|---|---|
| 0.00 | 1.09 | 2.1553 | -2.1779 | |
| 0.00 | 0.20 | 0.3947 | -1.4610 | |
| 0.02 | 0.40 | 0.7826 | -1.2616 | |
| 0.01 | 0.40 | 0.7840 | -1.1788 | |
| 0.01 | 0.69 | 1.3656 | -0.6736 | |
| 0.00 | 0.14 | 0.2823 | -0.5883 | |
| 0.00 | 0.14 | 0.2848 | -0.5229 | |
| 0.00 | 0.56 | 1.1165 | -0.5227 | |
| 0.00 | 1.06 | 2.0892 | -0.4972 | |
| 0.02 | 1.30 | 2.5772 | -0.4765 |
13F and Fund Filings
This form was filed on 2025-06-26 for the reporting period 2025-04-30. Click the link icon to see the full transaction history.
Upgrade to unlock premium data and export to Excel ![]() .
.
| Security | Type | Avg Share Price | Shares (MM) |
ΔShares (%) |
ΔShares (%) |
Value ($MM) |
Portfolio (%) |
ΔPortfolio (%) |
|
|---|---|---|---|---|---|---|---|---|---|
| GFL / GFL Environmental Inc. | 0.06 | 4.94 | 2.92 | 21.42 | 5.7795 | 1.8331 | |||
| PLTR / Palantir Technologies Inc. | 0.02 | -10.12 | 2.40 | 29.08 | 4.7455 | 1.6967 | |||
| CSU / Constellation Software Inc. | 0.00 | 8.39 | 2.28 | 19.49 | 4.5157 | 1.3813 | |||
| TLN / Talen Energy Corporation | 0.01 | 17.28 | 1.71 | 13.78 | 3.3834 | 0.9177 | |||
| OWL / Blue Owl Capital Inc. | 0.08 | 4.71 | 1.48 | -25.38 | 2.9336 | -0.3268 | |||
| NVR / NVR, Inc. | 0.00 | 5.18 | 1.45 | -6.53 | 2.8634 | 0.3243 | |||
| CBRE / CBRE Group, Inc. | 0.01 | 7.27 | 1.43 | -9.49 | 2.8343 | 0.2392 | |||
| NTRA / Natera, Inc. | 0.01 | -2.80 | 1.43 | -17.11 | 2.8302 | 0.0004 | |||
| US2619081076 / DREYFUS TREASURY PRIME CASH MANAGEMENT/ CLASS A | 1.43 | 794.15 | 1.43 | 798.11 | 2.8280 | 2.5878 | |||
| DSGX / The Descartes Systems Group Inc. | 0.01 | -7.68 | 1.40 | -16.01 | 2.7631 | 0.0358 | |||
| TKO / TKO Group Holdings, Inc. | 0.01 | 26.51 | 1.38 | 32.76 | 2.7285 | 1.0249 | |||
| NET / Cloudflare, Inc. | 0.01 | 23.08 | 1.36 | 7.45 | 2.6827 | 0.6120 | |||
| VRT / Vertiv Holdings Co | 0.02 | -4.10 | 1.30 | -30.05 | 2.5772 | -0.4765 | |||
| AXON / Axon Enterprise, Inc. | 0.00 | 106.80 | 1.21 | 94.54 | 2.4001 | 1.3769 | |||
| APH / Amphenol Corporation | 0.01 | -2.79 | 1.15 | 5.71 | 2.2726 | 0.4897 | |||
| GWRE / Guidewire Software, Inc. | 0.01 | -15.15 | 1.13 | -17.76 | 2.2277 | -0.0180 | |||
| IFC / Intact Financial Corporation | 0.01 | 15.48 | 1.12 | 44.44 | 2.2135 | 0.9425 | |||
| APP / AppLovin Corporation | 0.00 | -43.41 | 1.09 | -58.79 | 2.1553 | -2.1779 | |||
| FTAI / FTAI Aviation Ltd. | 0.01 | 46.02 | 1.08 | 55.48 | 2.1374 | 0.9983 | |||
| SPOT / Spotify Technology S.A. | 0.00 | -40.17 | 1.06 | -33.02 | 2.0892 | -0.4972 | |||
| HEI / HEICO Corporation | 0.00 | -17.77 | 1.05 | -13.70 | 2.0838 | 0.0819 | |||
| FIX / Comfort Systems USA, Inc. | 0.00 | 47.27 | 0.94 | 34.09 | 1.8706 | 0.7137 | |||
| VRSK / Verisk Analytics, Inc. | 0.00 | 80.25 | 0.94 | 85.97 | 1.8636 | 1.0324 | |||
| HLT / Hilton Worldwide Holdings Inc. | 0.00 | -11.91 | 0.88 | -22.48 | 1.7492 | -0.1205 | |||
| CWAN / Clearwater Analytics Holdings, Inc. | 0.04 | 3.45 | 0.88 | -16.43 | 1.7328 | 0.0131 | |||
| RYAN / Ryan Specialty Holdings, Inc. | 0.01 | 51.73 | 0.87 | 49.40 | 1.7256 | 0.7673 | |||
| HOOD / Robinhood Markets, Inc. | 0.02 | 429.57 | 0.80 | 401.26 | 1.5789 | 1.3174 | |||
| CMG / Chipotle Mexican Grill, Inc. | 0.02 | 6.29 | 0.77 | -7.94 | 1.5151 | 0.1502 | |||
| ORLY / O'Reilly Automotive, Inc. | 0.00 | -47.48 | 0.74 | 5.58 | 1.4623 | 0.3842 | |||
| RGEN / Repligen Corporation | 0.01 | -23.63 | 0.73 | -36.59 | 1.4521 | -0.4467 | |||
| RBLX / Roblox Corporation | 0.01 | -2.80 | 0.73 | -8.31 | 1.4427 | 0.1384 | |||
| CVNA / Carvana Co. | 0.00 | 20.33 | 0.72 | 18.91 | 1.4312 | 0.4325 | |||
| MLM / Martin Marietta Materials, Inc. | 0.00 | -8.66 | 0.72 | -12.12 | 1.4231 | 0.0818 | |||
| GLOB / Globant S.A. | 0.01 | 0.74 | 0.69 | -44.52 | 1.3656 | -0.6736 | |||
| IDXX / IDEXX Laboratories, Inc. | 0.00 | -2.84 | 0.65 | -0.31 | 1.2906 | 0.2163 | |||
| VEEV / Veeva Systems Inc. | 0.00 | -2.82 | 0.64 | -2.61 | 1.2582 | 0.1867 | |||
| CSGP / CoStar Group, Inc. | 0.01 | 16.71 | 0.64 | 12.99 | 1.2582 | 0.3351 | |||
| BLDR / Builders FirstSource, Inc. | 0.01 | -2.82 | 0.62 | -30.50 | 1.2314 | -0.2376 | |||
| MPWR / Monolithic Power Systems, Inc. | 0.00 | -2.96 | 0.62 | -9.74 | 1.2304 | 0.1007 | |||
| ARES / Ares Management Corporation | 0.00 | -26.61 | 0.56 | -43.49 | 1.1165 | -0.5227 | |||
| NU / Nu Holdings Ltd. | 0.04 | -27.39 | 0.55 | -31.84 | 1.0853 | -0.2347 | |||
| FICO / Fair Isaac Corporation | 0.00 | -90.38 | 0.45 | -63.53 | 0.8901 | -0.0088 | |||
| PCTY / Paylocity Holding Corporation | 0.00 | -2.87 | 0.44 | -9.37 | 0.8628 | 0.0749 | |||
| WST / West Pharmaceutical Services, Inc. | 0.00 | -2.85 | 0.42 | -39.94 | 0.8403 | -0.3189 | |||
| URI / United Rentals, Inc. | 0.00 | -26.66 | 0.40 | -38.97 | 0.8012 | -0.2861 | |||
| MRVL / Marvell Technology, Inc. | 0.01 | -35.97 | 0.40 | -66.86 | 0.7840 | -1.1788 | |||
| PINS / Pinterest, Inc. | 0.02 | -58.68 | 0.40 | -68.27 | 0.7826 | -1.2616 | |||
| CROSSLINK VENTURES C LLC CALSS A SHARES / EC (000000000) | 0.00 | 0.36 | 0.7114 | 0.7114 | |||||
| MSCI / MSCI Inc. | 0.00 | -45.67 | 0.34 | -50.36 | 0.6776 | -0.4545 | |||
| ALAB / Astera Labs, Inc. | 0.00 | -29.64 | 0.29 | -54.77 | 0.5734 | -0.4757 | |||
| ELF / e.l.f. Beauty, Inc. | 0.00 | -16.85 | 0.28 | -48.53 | 0.5554 | -0.3389 | |||
| SB Technology, Inc. Series E Preferred Stock / EP (000000000) | 0.02 | 0.28 | 0.5546 | 0.5546 | |||||
| PCOR / Procore Technologies, Inc. | 0.00 | -42.12 | 0.27 | -53.40 | 0.5297 | -0.4121 | |||
| FND / Floor & Decor Holdings, Inc. | 0.00 | -2.82 | 0.26 | -30.65 | 0.5118 | -0.1000 | |||
| ODFL / Old Dominion Freight Line, Inc. | 0.00 | -78.64 | 0.20 | -82.39 | 0.3947 | -1.4610 | |||
| ONTO / Onto Innovation Inc. | 0.00 | -2.75 | 0.19 | -42.22 | 0.3836 | -0.1654 | |||
| CROSSLINK VENTURES C LLC CLASS B SHARES / EC (000000000) | 0.00 | 0.15 | 0.2910 | 0.2910 | |||||
| GLBE / Global-E Online Ltd. | 0.00 | -51.25 | 0.14 | -70.93 | 0.2848 | -0.5229 | |||
| W / Wayfair Inc. | 0.00 | -56.88 | 0.14 | -73.21 | 0.2823 | -0.5883 | |||
| PCVX / Vaxcyte, Inc. | 0.00 | -44.01 | 0.08 | -77.30 | 0.1665 | -0.4411 | |||
| PROSETTA BIOSCIENCES INC. /PFD / EP (000000000) | 0.17 | 0.00 | 0.0000 | 0.0000 | |||||
| CA21037X1345 / CONSTELLATION SOFTWARE INC | 0.00 | 0.0000 | 0.0000 | ||||||
| TOLERO DCR / EC (000000000) | 0.42 | 0.00 | 0.0000 | 0.0000 |