Basic Stats
| Portfolio Value | $ 634,256,996 |
| Current Positions | 42 |
Latest Holdings, Performance, AUM (from 13F, 13D)
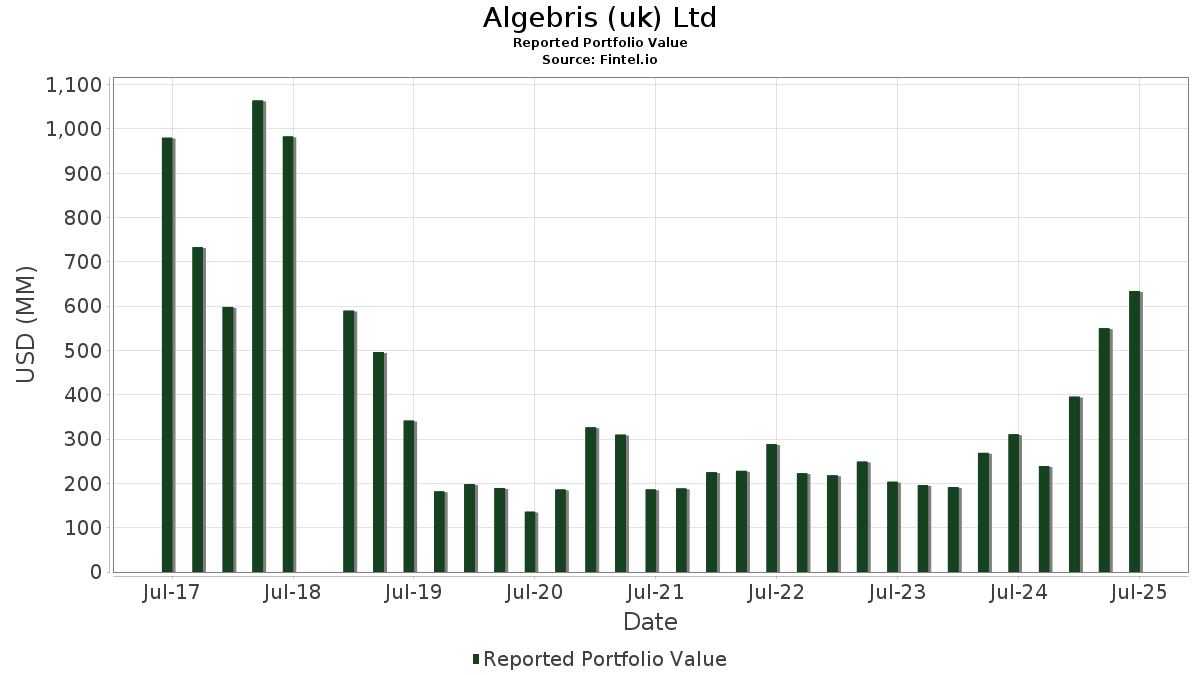
Algebris (uk) Ltd has disclosed 42 total holdings in their latest SEC filings. Most recent portfolio value is calculated to be $ 634,256,996 USD. Actual Assets Under Management (AUM) is this value plus cash (which is not disclosed). Algebris (uk) Ltd’s top holdings are Lincoln National Corporation (US:LNC) , Citigroup Inc. (US:C) , Citizens Financial Group, Inc. (US:CFG) , First Horizon Corporation (US:FHN) , and Bank of America Corporation (US:BAC) . Algebris (uk) Ltd’s new positions include Visa Inc. (US:V) , .
Top Increases This Quarter
We use the change in the portfolio allocation because this is the most meaningful metric. Changes can be due to trades or changes in share prices.
| Security | Shares (MM) |
Value (MM$) |
Portfolio % | ΔPortfolio % |
|---|---|---|---|---|
| 1.06 | 37.58 | 5.9243 | 3.1570 | |
| 2.15 | 45.47 | 7.1688 | 2.8186 | |
| 0.20 | 16.05 | 2.5300 | 2.5300 | |
| 1.51 | 52.13 | 8.2197 | 2.4485 | |
| 0.51 | 35.98 | 5.6721 | 1.6346 | |
| 0.61 | 52.07 | 8.2097 | 1.5325 | |
| 0.55 | 31.03 | 4.8922 | 1.3651 | |
| 0.13 | 7.46 | 1.1761 | 1.1761 | |
| 0.07 | 6.57 | 1.0363 | 1.0363 | |
| 1.12 | 50.00 | 7.8834 | 0.9446 |
Top Decreases This Quarter
We use the change in the portfolio allocation because this is the most meaningful metric. Changes can be due to trades or changes in share prices.
| Security | Shares (MM) |
Value (MM$) |
Portfolio % | ΔPortfolio % |
|---|---|---|---|---|
| 0.36 | 13.70 | 2.1604 | -2.8475 | |
| 0.04 | 7.46 | 1.1757 | -2.2930 | |
| 0.82 | 38.83 | 6.1221 | -2.1273 | |
| 0.41 | 32.90 | 5.1880 | -0.8904 | |
| 0.39 | 20.16 | 3.1788 | -0.3578 | |
| 0.01 | 1.83 | 0.2881 | -0.1672 | |
| 0.01 | 1.59 | 0.2513 | -0.1443 | |
| 0.00 | 1.14 | 0.1795 | -0.0206 | |
| 0.10 | 0.31 | 0.0488 | -0.0182 |
13F and Fund Filings
This form was filed on 2025-08-13 for the reporting period 2025-06-30. Click the link icon to see the full transaction history.
Upgrade to unlock premium data and export to Excel ![]() .
.
| Security | Type | Avg Share Price | Shares (MM) |
ΔShares (%) |
ΔShares (%) |
Value ($MM) |
Portfolio (%) |
ΔPortfolio (%) |
|
|---|---|---|---|---|---|---|---|---|---|
| LNC / Lincoln National Corporation | 1.51 | 58.06 | 52.13 | 64.24 | 8.2197 | 2.4485 | |||
| C / Citigroup Inc. | 0.61 | 9.64 | 52.07 | 41.79 | 8.2097 | 1.5325 | |||
| CFG / Citizens Financial Group, Inc. | 1.12 | 11.12 | 50.00 | 31.02 | 7.8834 | 0.9446 | |||
| FHN / First Horizon Corporation | 2.15 | 61.36 | 45.47 | 90.04 | 7.1688 | 2.8186 | |||
| BAC / Bank of America Corporation | 0.82 | -30.02 | 38.83 | -14.42 | 6.1221 | -2.1273 | |||
| CRBG / Corebridge Financial, Inc. | 1.06 | 103.57 | 37.58 | 146.88 | 5.9243 | 3.1570 | |||
| VOYA / Voya Financial, Inc. | 0.51 | 43.22 | 35.98 | 62.01 | 5.6721 | 1.6346 | |||
| MET / MetLife, Inc. | 0.41 | -8.89 | 32.90 | -1.58 | 5.1880 | -0.8904 | |||
| EQH / Equitable Holdings, Inc. | 0.55 | 37.71 | 31.03 | 59.95 | 4.8922 | 1.3651 | |||
| KEY / KeyCorp | 1.39 | 6.95 | 24.16 | 25.66 | 3.8093 | 0.3134 | |||
| WBS / Webster Financial Corporation | 0.39 | 5.15 | 21.36 | 20.11 | 3.3677 | 0.1343 | |||
| CG / The Carlyle Group Inc. | 0.39 | -18.50 | 20.16 | 3.65 | 3.1788 | -0.3578 | |||
| NLY / Annaly Capital Management, Inc. | 1.05 | 23.22 | 19.73 | 23.14 | 3.1108 | 0.1976 | |||
| ALIBABA GROUP HLDG LTD / NOTE0.500% 6/0 (01609WBG6) | 16.00 | 17.37 | 0.0000 | ||||||
| PB / Prosperity Bancshares, Inc. | 0.23 | 54.41 | 16.32 | 63.90 | 2.5726 | 0.7625 | |||
| UNM / Unum Group | 0.20 | 16.05 | 2.5300 | 2.5300 | |||||
| PCG.PRX / PG&E Corporation - Preferred Security | 0.36 | -45.11 | 13.70 | -50.25 | 2.1604 | -2.8475 | |||
| DX / Dynex Capital, Inc. | 0.99 | 82.64 | 12.04 | 84.87 | 1.8979 | 0.7141 | |||
| SNV / Synovus Financial Corp. | 0.23 | 16.29 | 11.82 | 38.87 | 1.8634 | 0.3160 | |||
| GPN / Global Payments Inc. | 0.14 | 174.01 | 11.23 | 141.57 | 1.7712 | 0.9256 | |||
| SF / Stifel Financial Corp. | 0.10 | 68.15 | 10.77 | 99.68 | 1.6986 | 0.7176 | |||
| SPECTRUM BRANDS INC / NOTE3.375% 6/0 (84762LAZ8) | 11.95 | 9.25 | 0.0000 | ||||||
| NCNO / nCino, Inc. | 0.33 | 24.48 | 9.14 | 36.71 | 1.4416 | 0.2254 | |||
| AMERICAN WTR CAP CORP / NOTE3.625% 6/1 (03040WBE4) | 8.90 | 7.62 | 0.0000 | ||||||
| CMA / Comerica Incorporated | 0.13 | 7.46 | 1.1761 | 1.1761 | |||||
| MTB / M&T Bank Corporation | 0.04 | -66.60 | 7.46 | -60.91 | 1.1757 | -2.2930 | |||
| SSB / SouthState Corporation | 0.07 | 6.57 | 1.0363 | 1.0363 | |||||
| COR / Cencora, Inc. | 0.01 | 4.20 | 1.95 | 21.17 | 0.3078 | 0.0149 | |||
| RSG / Republic Services, Inc. | 0.01 | -33.55 | 1.83 | -27.04 | 0.2881 | -0.1672 | |||
| V / Visa Inc. | 0.00 | 1.60 | 0.2528 | 0.2528 | |||||
| WM / Waste Management, Inc. | 0.01 | -31.28 | 1.59 | -26.79 | 0.2513 | -0.1443 | |||
| HERBALIFE LTD / NOTE4.250% 6/1 (42703MAF0) | 2.00 | 1.56 | 0.0000 | ||||||
| MSFT / Microsoft Corporation | 0.00 | 175.48 | 1.34 | 294.13 | 0.2120 | 0.1499 | |||
| ISRG / Intuitive Surgical, Inc. | 0.00 | 44.36 | 1.24 | 70.84 | 0.1960 | 0.0637 | |||
| SYK / Stryker Corporation | 0.00 | -9.74 | 1.14 | 3.45 | 0.1795 | -0.0206 | |||
| XYL / Xylem Inc. | 0.01 | 99.17 | 0.84 | 132.50 | 0.1321 | 0.0666 | |||
| GWW / W.W. Grainger, Inc. | 0.00 | 71.01 | 0.67 | 94.46 | 0.1053 | 0.0428 | |||
| HUBB / Hubbell Incorporated | 0.00 | 0.65 | 0.1020 | 0.1020 | |||||
| SNPS / Synopsys, Inc. | 0.00 | 96.80 | 0.54 | 153.55 | 0.0845 | 0.0461 | |||
| CLH / Clean Harbors, Inc. | 0.00 | 68.36 | 0.47 | 112.61 | 0.0746 | 0.0342 | |||
| CNM / Core & Main, Inc. | 0.01 | 0.32 | 0.0502 | 0.0502 | |||||
| GNTA / Genenta Science S.p.A. - Depositary Receipt (Common Stock) | 0.10 | 0.00 | 0.31 | -16.03 | 0.0488 | -0.0182 | |||
| EVR / Evercore Inc. | 0.00 | -100.00 | 0.00 | 0.0000 | |||||
| BBD / Banco Bradesco S.A. - Depositary Receipt (Common Stock) | 0.00 | -100.00 | 0.00 | 0.0000 | |||||
| CSL / Carlisle Companies Incorporated | 0.00 | -100.00 | 0.00 | 0.0000 | |||||
| PRU / Prudential Financial, Inc. | 0.00 | -100.00 | 0.00 | 0.0000 | |||||
| WFC / Wells Fargo & Company | 0.00 | -100.00 | 0.00 | 0.0000 | |||||
| AIR TRANS SVCS GROUP INC / NOTE 3.875% 8/1 (00922RAD7) | 0.00 | -100.00 | 0.00 | 0.0000 | |||||
| ALKT / Alkami Technology, Inc. | 0.00 | -100.00 | 0.00 | 0.0000 | |||||
| BHF / Brighthouse Financial, Inc. | 0.00 | -100.00 | 0.00 | 0.0000 | |||||
| TFC / Truist Financial Corporation | 0.00 | -100.00 | 0.00 | 0.0000 |