Basic Stats
| Portfolio Value | $ 21,323,146,878 |
| Current Positions | 66 |
Latest Holdings, Performance, AUM (from 13F, 13D)
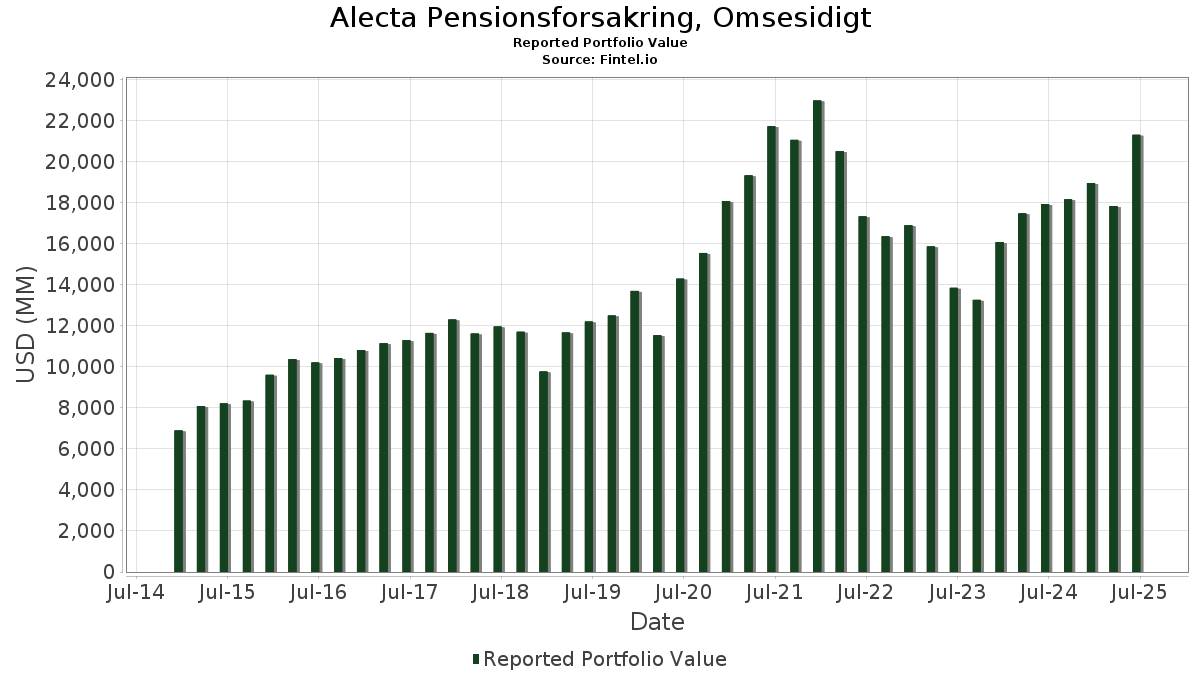
Alecta Pensionsforsakring, Omsesidigt has disclosed 66 total holdings in their latest SEC filings. Most recent portfolio value is calculated to be $ 21,323,146,878 USD. Actual Assets Under Management (AUM) is this value plus cash (which is not disclosed). Alecta Pensionsforsakring, Omsesidigt’s top holdings are Microsoft Corporation (US:MSFT) , Alphabet Inc. (US:GOOGL) , Amazon.com, Inc. (US:AMZN) , Direxion Shares ETF Trust - Direxion Daily NVDA Bear 1X Shares (US:NVDD) , and Amphenol Corporation (US:APH) . Alecta Pensionsforsakring, Omsesidigt’s new positions include McKesson Corporation (US:MCK) , Intuitive Surgical, Inc. (US:ISRG) , The Home Depot, Inc. (US:HD) , .
Top Increases This Quarter
We use the change in the portfolio allocation because this is the most meaningful metric. Changes can be due to trades or changes in share prices.
| Security | Shares (MM) |
Value (MM$) |
Portfolio % | ΔPortfolio % |
|---|---|---|---|---|
| 7.17 | 1,132.42 | 5.3108 | 1.4420 | |
| 2.08 | 573.39 | 2.6891 | 1.2369 | |
| 4.54 | 2,255.58 | 10.5781 | 1.1873 | |
| 2.56 | 524.09 | 2.4578 | 1.1466 | |
| 1.19 | 260.72 | 1.2227 | 0.5702 | |
| 0.14 | 102.19 | 0.4792 | 0.4792 | |
| 2.23 | 316.98 | 1.4866 | 0.4770 | |
| 0.17 | 92.22 | 0.4325 | 0.4325 | |
| 0.44 | 591.53 | 2.7741 | 0.4172 | |
| 1.65 | 301.82 | 1.4154 | 0.3345 |
Top Decreases This Quarter
We use the change in the portfolio allocation because this is the most meaningful metric. Changes can be due to trades or changes in share prices.
| Security | Shares (MM) |
Value (MM$) |
Portfolio % | ΔPortfolio % |
|---|---|---|---|---|
| 0.71 | 288.94 | 1.3550 | -1.0171 | |
| 5.73 | 707.69 | 3.3189 | -0.8400 | |
| 1.52 | 540.11 | 2.5330 | -0.8073 | |
| 1.11 | 219.97 | 1.0316 | -0.7281 | |
| 5.19 | 1,137.40 | 5.3341 | -0.6979 | |
| 2.22 | 402.34 | 1.8869 | -0.6469 | |
| 3.45 | 245.32 | 1.1505 | -0.6325 | |
| 0.54 | 422.69 | 1.9823 | -0.5270 | |
| 7.83 | 1,379.39 | 6.4690 | -0.5007 | |
| 1.05 | 194.59 | 0.9126 | -0.3187 |
13F and Fund Filings
This form was filed on 2025-07-10 for the reporting period 2025-06-30. Click the link icon to see the full transaction history.
Upgrade to unlock premium data and export to Excel ![]() .
.
| Security | Type | Avg Share Price | Shares (MM) |
ΔShares (%) |
ΔShares (%) |
Value ($MM) |
Portfolio (%) |
ΔPortfolio (%) |
|
|---|---|---|---|---|---|---|---|---|---|
| MSFT / Microsoft Corporation | 4.54 | 1.48 | 2,255.58 | 34.58 | 10.5781 | 1.1873 | |||
| GOOGL / Alphabet Inc. | 7.83 | -2.74 | 1,379.39 | 10.89 | 6.4690 | -0.5007 | |||
| AMZN / Amazon.com, Inc. | 5.19 | -8.37 | 1,137.40 | 5.65 | 5.3341 | -0.6979 | |||
| NVDD / Direxion Shares ETF Trust - Direxion Daily NVDA Bear 1X Shares | 7.17 | 12.99 | 1,132.42 | 64.01 | 5.3108 | 1.4420 | |||
| APH / Amphenol Corporation | 8.43 | -22.98 | 831.97 | 15.93 | 3.9017 | -0.1193 | |||
| TJX / The TJX Companies, Inc. | 5.73 | -5.99 | 707.69 | -4.66 | 3.3189 | -0.8400 | |||
| NFLX / Netflix, Inc. | 0.44 | -2.04 | 591.53 | 40.62 | 2.7741 | 0.4172 | |||
| AVGO / Broadcom Inc. | 2.08 | 34.37 | 573.39 | 121.23 | 2.6891 | 1.2369 | |||
| V / Visa Inc. | 1.52 | -10.52 | 540.11 | -9.40 | 2.5330 | -0.8073 | |||
| TXN / Texas Instruments Incorporated | 2.58 | -7.85 | 536.00 | 6.36 | 2.5137 | -0.3099 | |||
| AAPL / Apple Inc. | 2.56 | 142.50 | 524.09 | 123.94 | 2.4578 | 1.1466 | |||
| DIS / The Walt Disney Company | 3.89 | 6.31 | 482.14 | 33.52 | 2.2611 | 0.2378 | |||
| SPOT / Spotify Technology S.A. | 0.62 | -19.60 | 476.13 | 12.04 | 2.2329 | -0.1482 | |||
| LLY / Eli Lilly and Company | 0.54 | 0.00 | 422.69 | -5.62 | 1.9823 | -0.5270 | |||
| AME / AMETEK, Inc. | 2.22 | -15.38 | 402.34 | -11.03 | 1.8869 | -0.6469 | |||
| FTXP / Foothills Exploration, Inc. | 0.43 | -7.59 | 384.91 | 21.78 | 1.8051 | 0.0342 | |||
| JPM / JPMorgan Chase & Co. | 1.24 | 9.42 | 360.03 | 29.28 | 1.6884 | 0.1280 | |||
| AMD / Advanced Micro Devices, Inc. | 2.23 | 27.37 | 316.98 | 75.92 | 1.4866 | 0.4770 | |||
| ADI / Analog Devices, Inc. | 1.31 | 0.00 | 310.88 | 18.02 | 1.4580 | -0.0179 | |||
| CTAS / Cintas Corporation | 1.39 | 0.00 | 309.78 | 8.40 | 1.4528 | -0.1484 | |||
| ITW / Illinois Tool Works Inc. | 1.24 | 0.00 | 305.53 | -0.38 | 1.4328 | -0.2855 | |||
| SPGI / S&P Global Inc. | 0.57 | 0.00 | 303.01 | 3.68 | 1.4211 | -0.2164 | |||
| AMAT / Applied Materials, Inc. | 1.65 | 24.17 | 301.82 | 56.45 | 1.4154 | 0.3345 | |||
| ROK / Rockwell Automation, Inc. | 0.89 | -10.96 | 295.77 | 14.49 | 1.3871 | -0.0603 | |||
| BSX / Boston Scientific Corporation | 2.74 | 0.00 | 294.47 | 6.43 | 1.3810 | -0.1692 | |||
| BAC / Bank of America Corporation | 6.21 | 0.00 | 293.41 | 13.22 | 1.3760 | -0.0760 | |||
| TMO / Thermo Fisher Scientific Inc. | 0.71 | -16.20 | 288.94 | -31.75 | 1.3550 | -1.0171 | |||
| ORCL / Oracle Corporation | 1.19 | 43.22 | 260.72 | 123.88 | 1.2227 | 0.5702 | |||
| LIN / Linde plc | 0.55 | 9.02 | 256.28 | 9.80 | 1.2019 | -0.1059 | |||
| NKE / NIKE, Inc. | 3.45 | -31.05 | 245.32 | -22.91 | 1.1505 | -0.6325 | |||
| ULTA / Ulta Beauty, Inc. | 0.49 | 0.00 | 228.58 | 27.61 | 1.0720 | 0.0684 | |||
| DHR / Danaher Corporation | 1.11 | -27.33 | 219.97 | -29.96 | 1.0316 | -0.7281 | |||
| ECL / Ecolab Inc. | 0.76 | 0.00 | 203.53 | 6.33 | 0.9545 | -0.1180 | |||
| ABBV / AbbVie Inc. | 1.05 | 0.00 | 194.59 | -11.45 | 0.9126 | -0.3187 | |||
| ABT / Abbott Laboratories | 1.39 | 79.02 | 188.70 | 83.46 | 0.8849 | 0.3086 | |||
| EL / The Estée Lauder Companies Inc. | 2.29 | -11.88 | 184.63 | 7.85 | 0.8659 | -0.0933 | |||
| SYK / Stryker Corporation | 0.46 | 82.01 | 181.23 | 93.37 | 0.8499 | 0.3248 | |||
| DG / Dollar General Corporation | 1.55 | -12.27 | 176.82 | 14.09 | 0.8293 | -0.0391 | |||
| TT / Trane Technologies plc | 0.40 | 0.00 | 174.89 | 29.80 | 0.8202 | 0.0653 | |||
| SNPS / Synopsys, Inc. | 0.33 | 15.73 | 169.68 | 38.41 | 0.7957 | 0.1089 | |||
| ACN / Accenture plc | 0.56 | 49.46 | 166.04 | 42.97 | 0.7787 | 0.1280 | |||
| TSCO / Tractor Supply Company | 3.13 | -8.00 | 165.28 | -11.91 | 0.7751 | -0.2761 | |||
| PNC / The PNC Financial Services Group, Inc. | 0.85 | 17.18 | 157.63 | 24.31 | 0.7392 | 0.0287 | |||
| GGG / Graco Inc. | 1.75 | 0.00 | 150.41 | 2.95 | 0.7054 | -0.1132 | |||
| ANSS / ANSYS, Inc. | 0.40 | 0.00 | 140.37 | 10.97 | 0.6583 | -0.0505 | |||
| COST / Costco Wholesale Corporation | 0.14 | -6.17 | 138.50 | -1.83 | 0.6495 | -0.1409 | |||
| CRM / Salesforce, Inc. | 0.49 | 39.44 | 134.94 | 41.71 | 0.6328 | 0.0993 | |||
| MKC / McCormick & Company, Incorporated | 1.78 | 94.75 | 134.79 | 79.34 | 0.6322 | 0.2110 | |||
| MS / Morgan Stanley | 0.94 | 61.03 | 132.62 | 94.28 | 0.6220 | 0.2395 | |||
| MRK / Merck & Co., Inc. | 1.64 | 0.00 | 129.75 | -11.82 | 0.6085 | -0.2159 | |||
| CAT / Caterpillar Inc. | 0.33 | 0.00 | 127.51 | 17.63 | 0.5980 | -0.0094 | |||
| UNH / UnitedHealth Group Incorporated | 0.40 | 84.14 | 124.88 | 9.68 | 0.5857 | -0.0523 | |||
| IEX / IDEX Corporation | 0.69 | -13.76 | 121.13 | -16.25 | 0.5680 | -0.2423 | |||
| BKNG / Booking Holdings Inc. | 0.02 | 0.00 | 110.95 | 25.61 | 0.5203 | 0.0254 | |||
| ZTS / Zoetis Inc. | 0.71 | 24.46 | 110.66 | 17.86 | 0.5190 | -0.0071 | |||
| USB / U.S. Bancorp | 2.41 | -21.66 | 109.14 | -16.05 | 0.5118 | -0.2166 | |||
| MCK / McKesson Corporation | 0.14 | 102.19 | 0.4792 | 0.4792 | |||||
| COO / The Cooper Companies, Inc. | 1.35 | 60.71 | 96.03 | 35.58 | 0.4504 | 0.0535 | |||
| ISRG / Intuitive Surgical, Inc. | 0.17 | 92.22 | 0.4325 | 0.4325 | |||||
| PODD / Insulet Corporation | 0.27 | 30.18 | 83.33 | 55.83 | 0.3908 | 0.0912 | |||
| ADBE / Adobe Inc. | 0.20 | 0.00 | 76.57 | 0.86 | 0.3591 | -0.0663 | |||
| WMT / Walmart Inc. | 0.77 | 71.15 | 75.10 | 90.49 | 0.3522 | 0.1313 | |||
| FITB / Fifth Third Bancorp | 1.46 | 39.62 | 60.06 | 46.54 | 0.2817 | 0.0520 | |||
| HD / The Home Depot, Inc. | 0.14 | 51.65 | 0.2422 | 0.2422 | |||||
| INTC / Intel Corporation | 2.01 | 0.00 | 44.97 | -1.45 | 0.2109 | -0.0448 | |||
| BFB / Brown-Forman Corp. - Class B | 1.60 | 0.00 | 43.04 | -20.67 | 0.2018 | -0.1022 | |||
| PSNY / Polestar Automotive Holding UK PLC - Depositary Receipt (Common Stock) | 0.00 | -100.00 | 0.00 | -100.00 | -0.0172 | ||||
| BBWI / Bath & Body Works, Inc. | 0.00 | -100.00 | 0.00 | 0.0000 |