Basic Stats
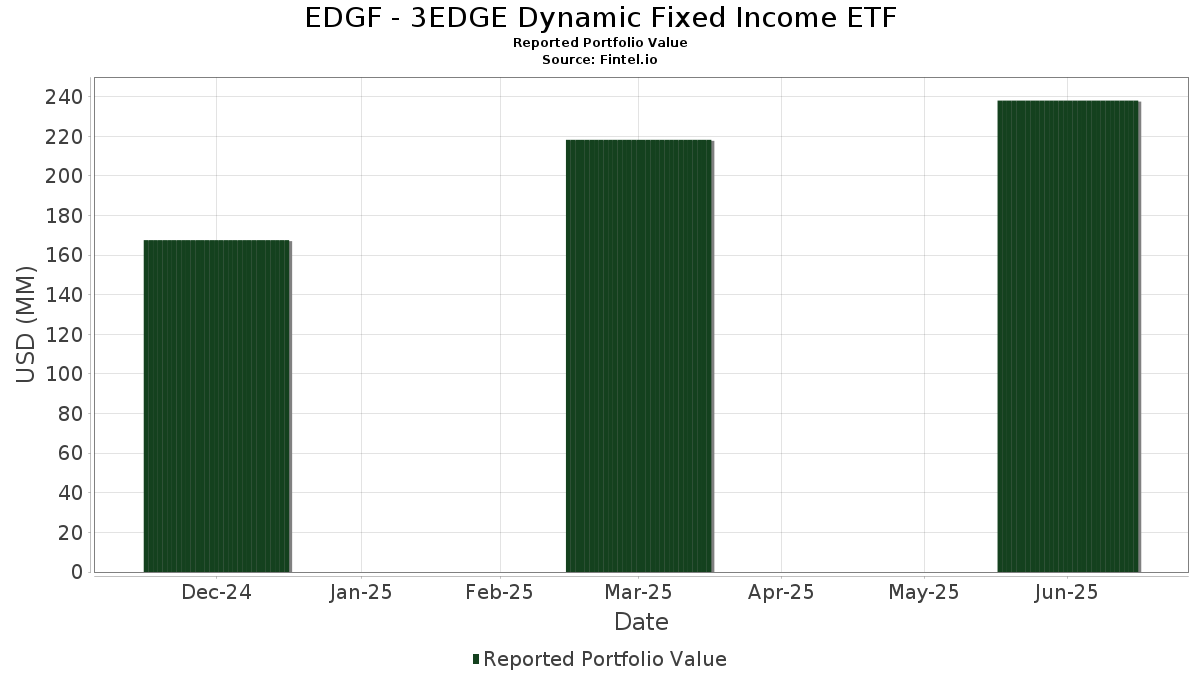
| Portfolio Value | $ 238,024,143 |
| Current Positions | 10 |
Latest Holdings, Performance, AUM (from 13F, 13D)
EDGF - 3EDGE Dynamic Fixed Income ETF has disclosed 10 total holdings in their latest SEC filings. Most recent portfolio value is calculated to be $ 238,024,143 USD. Actual Assets Under Management (AUM) is this value plus cash (which is not disclosed). EDGF - 3EDGE Dynamic Fixed Income ETF’s top holdings are MOUNT VERNON LIQUID ASSETS PORTFOLIO (US:990VR1110) , SPDR Series Trust - SPDR Bloomberg 1-3 Month T-Bill ETF (US:BIL) , Goldman Sachs ETF Trust - Goldman Sachs Access Treasury 0-1 Year ETF (US:GBIL) , SPDR Series Trust - SPDR Portfolio TIPS ETF (US:SPIP) , and iShares Trust - iShares 0-3 Month Treasury Bond ETF (US:SGOV) . EDGF - 3EDGE Dynamic Fixed Income ETF’s new positions include First American Funds Inc - First American Government Obligations Fund Class X (US:FGXXX) , .
Top Increases This Quarter
We use the change in the portfolio allocation because this is the most meaningful metric. Changes can be due to trades or changes in share prices.
| Security | Shares (MM) |
Value (MM$) |
Portfolio % | ΔPortfolio % |
|---|---|---|---|---|
| 0.38 | 37.67 | 19.1811 | 11.2348 | |
| 0.42 | 38.35 | 19.5262 | 10.5923 | |
| 0.04 | 4.51 | 2.2970 | 2.2970 | |
| 1.97 | 1.0012 | 0.3535 | ||
| 0.28 | 28.48 | 14.5015 | 0.1074 |
Top Decreases This Quarter
We use the change in the portfolio allocation because this is the most meaningful metric. Changes can be due to trades or changes in share prices.
| Security | Shares (MM) |
Value (MM$) |
Portfolio % | ΔPortfolio % |
|---|---|---|---|---|
| 40.57 | 40.57 | 20.6578 | -13.9997 | |
| 1.28 | 33.25 | 16.9330 | -5.5206 | |
| 0.33 | 19.77 | 10.0686 | -3.9040 | |
| 0.54 | 15.65 | 7.9704 | -2.6701 | |
| 0.16 | 17.81 | 9.0700 | -2.2575 |
13F and Fund Filings
This form was filed on 2025-08-28 for the reporting period 2025-06-30. Click the link icon to see the full transaction history.
Upgrade to unlock premium data and export to Excel ![]() .
.