Basic Stats
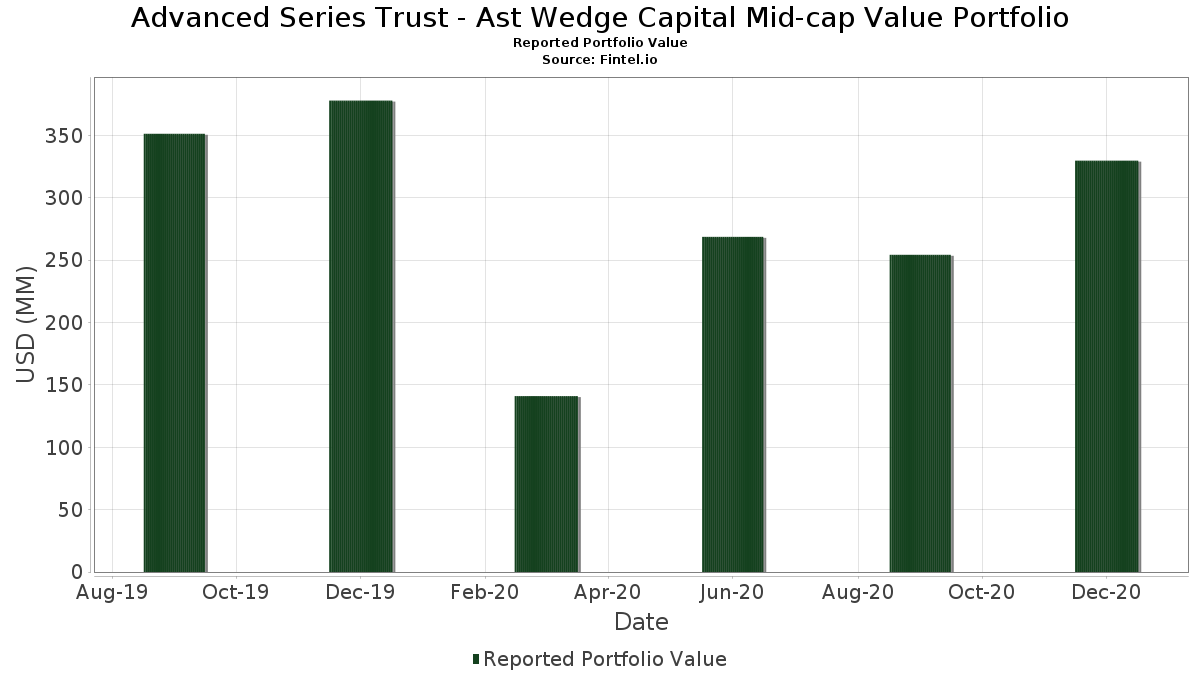
| Portfolio Value | $ 329,731,590 |
| Current Positions | 50 |
Latest Holdings, Performance, AUM (from 13F, 13D)
Advanced Series Trust - Ast Wedge Capital Mid-cap Value Portfolio has disclosed 50 total holdings in their latest SEC filings. Most recent portfolio value is calculated to be $ 329,731,590 USD. Actual Assets Under Management (AUM) is this value plus cash (which is not disclosed). Advanced Series Trust - Ast Wedge Capital Mid-cap Value Portfolio’s top holdings are Ally Financial Inc. (US:ALLY) , Republic Services, Inc. (US:RSG) , Altice USA, Inc. (US:ATUS) , Universal Health Services, Inc. (US:UHS) , and Packaging Corporation of America (US:PKG) . Advanced Series Trust - Ast Wedge Capital Mid-cap Value Portfolio’s new positions include PROG Holdings, Inc. (US:PRG) , APA Corporation (US:APA) , Cheniere Energy, Inc. (US:LNG) , Sealed Air Corporation (US:SEE) , and .
Top Increases This Quarter
We use the change in the portfolio allocation because this is the most meaningful metric. Changes can be due to trades or changes in share prices.
| Security | Shares (MM) |
Value (MM$) |
Portfolio % | ΔPortfolio % |
|---|---|---|---|---|
| 9.70 | 9.70 | 3.0429 | 3.0429 | |
| 0.18 | 9.67 | 3.0341 | 3.0341 | |
| 0.35 | 4.95 | 1.5526 | 1.5526 | |
| 0.07 | 4.16 | 1.3051 | 1.3051 | |
| 0.08 | 3.74 | 1.1727 | 1.1727 | |
| 0.18 | 6.66 | 2.0903 | 1.1188 | |
| 0.06 | 7.88 | 2.4719 | 0.7954 | |
| 0.13 | 8.10 | 2.5411 | 0.7722 | |
| 0.83 | 9.08 | 2.8498 | 0.6234 | |
| 0.48 | 9.38 | 2.9428 | 0.6032 |
Top Decreases This Quarter
We use the change in the portfolio allocation because this is the most meaningful metric. Changes can be due to trades or changes in share prices.
| Security | Shares (MM) |
Value (MM$) |
Portfolio % | ΔPortfolio % |
|---|---|---|---|---|
| 0.09 | 1.79 | 0.5606 | -3.4863 | |
| 0.00 | 0.00 | -1.3484 | ||
| 0.03 | 5.25 | 1.6487 | -0.5922 | |
| 0.10 | 9.83 | 3.0847 | -0.5433 | |
| 0.11 | 5.16 | 1.6180 | -0.4998 | |
| 0.04 | 6.04 | 1.8950 | -0.4974 | |
| 0.11 | 3.53 | 1.1084 | -0.4060 | |
| 0.01 | 7.73 | 2.4241 | -0.3421 | |
| 0.12 | 9.28 | 2.9117 | -0.3385 | |
| 0.22 | 1.79 | 0.5621 | -0.3286 |
13F and Fund Filings
This form was filed on 2021-02-19 for the reporting period 2020-12-31. Click the link icon to see the full transaction history.
Upgrade to unlock premium data and export to Excel ![]() .
.
| Security | Type | Avg Share Price | Shares (MM) |
ΔShares (%) |
ΔShares (%) |
Value ($MM) |
Portfolio (%) |
ΔPortfolio (%) |
|
|---|---|---|---|---|---|---|---|---|---|
| ALLY / Ally Financial Inc. | 0.39 | -4.62 | 14.04 | 35.67 | 4.4058 | 0.3153 | |||
| RSG / Republic Services, Inc. | 0.11 | 16.36 | 10.92 | 20.04 | 3.4261 | -0.1691 | |||
| ATUS / Altice USA, Inc. | 0.29 | -11.91 | 10.87 | 28.31 | 3.4117 | 0.0623 | |||
| UHS / Universal Health Services, Inc. | 0.08 | 0.00 | 10.49 | 28.49 | 3.2915 | 0.0645 | |||
| PKG / Packaging Corporation of America | 0.07 | -3.18 | 10.10 | 22.45 | 3.1680 | -0.0911 | |||
| EVRG / Evergy, Inc. | 0.18 | 17.70 | 9.95 | 28.57 | 3.1218 | 0.0631 | |||
| ETR / Entergy Corporation | 0.10 | 5.70 | 9.83 | 7.10 | 3.0847 | -0.5433 | |||
| DOV / Dover Corporation | 0.08 | 2.12 | 9.76 | 19.02 | 3.0631 | -0.1791 | |||
| PGIM Institutional Money Market Fund - D / STIV (000000000) | 9.70 | 9.70 | 3.0429 | 3.0429 | |||||
| PRG / PROG Holdings, Inc. | 0.18 | 9.67 | 3.0341 | 3.0341 | |||||
| ZBH / Zimmer Biomet Holdings, Inc. | 0.06 | 0.70 | 9.42 | 13.96 | 2.9554 | -0.3110 | |||
| DAN / Dana Incorporated | 0.48 | 0.00 | 9.38 | 58.43 | 2.9428 | 0.6032 | |||
| ASH / Ashland Inc. | 0.12 | 1.05 | 9.28 | 12.84 | 2.9117 | -0.3385 | |||
| QVCGA / QVC Group Inc. | 0.83 | 5.53 | 9.08 | 61.25 | 2.8498 | 0.6234 | |||
| / Wyndham Destinations, Inc. | 0.20 | -6.36 | 9.05 | 36.57 | 2.8391 | 0.2203 | |||
| FNF / Fidelity National Financial, Inc. | 0.22 | 3.95 | 8.43 | 29.78 | 2.6443 | 0.0778 | |||
| ATGE / Adtalem Global Education Inc. | 0.24 | -0.86 | 8.27 | 37.15 | 2.5935 | 0.2116 | |||
| PNFP / Pinnacle Financial Partners, Inc. | 0.13 | 0.00 | 8.10 | 80.94 | 2.5411 | 0.7722 | |||
| SBNY / Signature Bank | 0.06 | 13.93 | 7.88 | 85.71 | 2.4719 | 0.7954 | |||
| TDG / TransDigm Group Incorporated | 0.01 | -15.25 | 7.73 | 10.39 | 2.4241 | -0.3421 | |||
| EHC / Encompass Health Corporation | 0.08 | 10.83 | 6.72 | 41.05 | 2.1087 | 0.2254 | |||
| USFD / US Foods Holding Corp. | 0.20 | -10.95 | 6.67 | 33.51 | 2.0911 | 0.1180 | |||
| ACGL / Arch Capital Group Ltd. | 0.18 | 119.77 | 6.66 | 171.03 | 2.0903 | 1.1188 | |||
| LBRDK / Liberty Broadband Corporation | 0.04 | 40.86 | 6.45 | 56.15 | 2.0226 | 0.3909 | |||
| LAMR / Lamar Advertising Company | 0.08 | -7.53 | 6.42 | 16.30 | 2.0152 | -0.1675 | |||
| MGP / MGM Growth Properties LLC - Class A | 0.20 | -0.84 | 6.32 | 10.93 | 1.9842 | -0.2691 | |||
| AXS / AXIS Capital Holdings Limited | 0.12 | 3.31 | 6.23 | 18.21 | 1.9554 | -0.1283 | |||
| AIZ / Assurant, Inc. | 0.04 | -11.15 | 6.04 | -0.23 | 1.8950 | -0.4974 | |||
| AER / AerCap Holdings N.V. | 0.12 | 0.00 | 5.42 | 80.96 | 1.7000 | 0.5166 | |||
| UGI / UGI Corporation | 0.15 | 2.53 | 5.31 | 8.70 | 1.6660 | -0.2649 | |||
| AVB / AvalonBay Communities, Inc. | 0.03 | -13.73 | 5.25 | -7.34 | 1.6487 | -0.5922 | |||
| EMN / Eastman Chemical Company | 0.05 | 0.99 | 5.19 | 29.63 | 1.6269 | 0.0460 | |||
| MRVL / Marvell Technology, Inc. | 0.11 | -19.64 | 5.16 | -3.77 | 1.6180 | -0.4998 | |||
| APA / APA Corporation | 0.35 | 4.95 | 1.5526 | 1.5526 | |||||
| CSL / Carlisle Companies Incorporated | 0.03 | 50.18 | 4.89 | 91.69 | 1.5345 | 0.5260 | |||
| MKL / Markel Group Inc. | 0.00 | 26.24 | 4.87 | 33.98 | 1.5269 | 0.0912 | |||
| STAG / STAG Industrial, Inc. | 0.15 | 25.58 | 4.61 | 29.00 | 1.4463 | 0.0340 | |||
| LNG / Cheniere Energy, Inc. | 0.07 | 4.16 | 1.3051 | 1.3051 | |||||
| VAC / Marriott Vacations Worldwide Corporation | 0.03 | -33.55 | 4.08 | 0.42 | 1.2807 | -0.3258 | |||
| AFG / American Financial Group, Inc. | 0.04 | 0.00 | 3.87 | 30.79 | 1.2157 | 0.0451 | |||
| SEE / Sealed Air Corporation | 0.08 | 3.74 | 1.1727 | 1.1727 | |||||
| ADS / Bread Financial Holdings Inc | 0.05 | 0.00 | 3.64 | 76.55 | 1.1412 | 0.3268 | |||
| EPR / EPR Properties | 0.11 | -21.99 | 3.53 | -7.80 | 1.1084 | -0.4060 | |||
| EVR / Evercore Inc. | 0.03 | -26.46 | 3.31 | 23.20 | 1.0380 | -0.0235 | |||
| SLM / SLM Corporation | 0.26 | -24.28 | 3.22 | 15.97 | 1.0095 | -0.0871 | |||
| ALK / Alaska Air Group, Inc. | 0.06 | 0.00 | 2.97 | 41.92 | 0.9318 | 0.1050 | |||
| EQT / EQT Corporation | 0.21 | 10.29 | 2.69 | 8.44 | 0.8425 | -0.1364 | |||
| PGIM Core Ultra Short Bond Fund / STIV (000000000) | 1.84 | 1.84 | 0.5758 | 0.5758 | |||||
| ETRN / Equitrans Midstream Corporation | 0.22 | -16.35 | 1.79 | -20.51 | 0.5621 | -0.3286 | |||
| AAN / The Aaron's Company, Inc. | 0.09 | -47.87 | 1.79 | -82.56 | 0.5606 | -3.4863 | |||
| MUR / Murphy Oil Corporation | 0.00 | -100.00 | 0.00 | -100.00 | -1.3484 |