Basic Stats
| Portfolio Value | $ 489,886,299 |
| Current Positions | 37 |
Latest Holdings, Performance, AUM (from 13F, 13D)
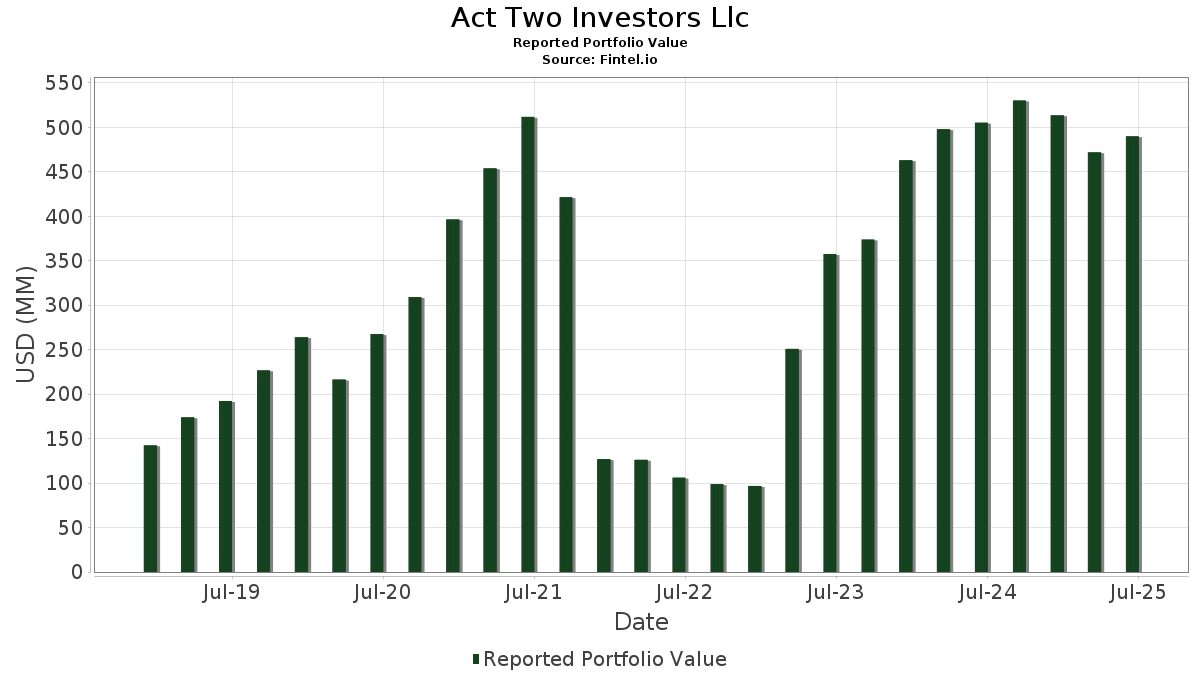
Act Two Investors Llc has disclosed 37 total holdings in their latest SEC filings. Most recent portfolio value is calculated to be $ 489,886,299 USD. Actual Assets Under Management (AUM) is this value plus cash (which is not disclosed). Act Two Investors Llc’s top holdings are Microsoft Corporation (US:MSFT) , Alphabet Inc. (US:GOOG) , Amazon.com, Inc. (US:AMZN) , Visa Inc. (US:V) , and T-Mobile US, Inc. (US:TMUS) . Act Two Investors Llc’s new positions include IQVIA Holdings Inc. (US:IQV) , Amgen Inc. (US:AMGN) , .
Top Increases This Quarter
We use the change in the portfolio allocation because this is the most meaningful metric. Changes can be due to trades or changes in share prices.
| Security | Shares (MM) |
Value (MM$) |
Portfolio % | ΔPortfolio % |
|---|---|---|---|---|
| 0.17 | 26.53 | 5.4151 | 5.4151 | |
| 0.15 | 74.85 | 15.2795 | 3.2049 | |
| 0.05 | 12.91 | 2.6343 | 2.6343 | |
| 0.44 | 27.80 | 5.6753 | 1.6324 | |
| 0.14 | 24.51 | 5.0038 | 1.1135 | |
| 0.11 | 16.93 | 3.4549 | 0.9692 | |
| 0.36 | 25.47 | 5.1996 | 0.9572 | |
| 0.24 | 23.25 | 4.7458 | 0.9296 | |
| 0.19 | 41.40 | 8.4517 | 0.8022 | |
| 0.26 | 46.99 | 9.5916 | 0.4136 |
Top Decreases This Quarter
We use the change in the portfolio allocation because this is the most meaningful metric. Changes can be due to trades or changes in share prices.
| Security | Shares (MM) |
Value (MM$) |
Portfolio % | ΔPortfolio % |
|---|---|---|---|---|
| 0.00 | 0.21 | 0.0436 | -5.1983 | |
| 0.05 | 9.84 | 2.0079 | -2.3816 | |
| 0.16 | 37.21 | 7.5948 | -2.1977 | |
| 0.09 | 17.94 | 3.6631 | -0.4546 | |
| 0.11 | 37.69 | 7.6945 | -0.2644 | |
| 0.01 | 2.72 | 0.5554 | -0.1523 | |
| 0.00 | 2.32 | 0.4738 | -0.0669 | |
| 0.01 | 1.96 | 0.4008 | -0.0441 | |
| 0.00 | 0.76 | 0.1545 | -0.0249 | |
| 0.37 | 9.29 | 1.8962 | -0.0217 |
13F and Fund Filings
This form was filed on 2025-08-12 for the reporting period 2025-06-30. Click the link icon to see the full transaction history.
Upgrade to unlock premium data and export to Excel ![]() .
.
| Security | Type | Avg Share Price | Shares (MM) |
ΔShares (%) |
ΔShares (%) |
Value ($MM) |
Portfolio (%) |
ΔPortfolio (%) |
|
|---|---|---|---|---|---|---|---|---|---|
| MSFT / Microsoft Corporation | 0.15 | -0.84 | 74.85 | 31.39 | 15.2795 | 3.2049 | |||
| GOOG / Alphabet Inc. | 0.26 | -4.44 | 46.99 | 8.50 | 9.5916 | 0.4136 | |||
| AMZN / Amazon.com, Inc. | 0.19 | -0.52 | 41.40 | 14.72 | 8.4517 | 0.8022 | |||
| V / Visa Inc. | 0.11 | -0.92 | 37.69 | 0.38 | 7.6945 | -0.2644 | |||
| TMUS / T-Mobile US, Inc. | 0.16 | -9.86 | 37.21 | -19.47 | 7.5948 | -2.1977 | |||
| ES / Eversource Energy | 0.44 | 42.29 | 27.80 | 45.75 | 5.6753 | 1.6324 | |||
| IQV / IQVIA Holdings Inc. | 0.17 | 26.53 | 5.4151 | 5.4151 | |||||
| AZN / AstraZeneca PLC - Depositary Receipt (Common Stock) | 0.36 | 33.85 | 25.47 | 27.26 | 5.1996 | 0.9572 | |||
| FI / Fiserv, Inc. | 0.14 | 71.05 | 24.51 | 33.54 | 5.0038 | 1.1135 | |||
| IEF / iShares Trust - iShares 7-10 Year Treasury Bond ETF | 0.24 | 28.58 | 23.25 | 29.12 | 4.7458 | 0.9296 | |||
| AAPL / Apple Inc. | 0.09 | 0.00 | 17.94 | -7.64 | 3.6631 | -0.4546 | |||
| NVDA / NVIDIA Corporation | 0.11 | -1.00 | 16.93 | 44.31 | 3.4549 | 0.9692 | |||
| AMGN / Amgen Inc. | 0.05 | 12.91 | 2.6343 | 2.6343 | |||||
| NXPI / NXP Semiconductors N.V. | 0.05 | -58.69 | 9.84 | -52.51 | 2.0079 | -2.3816 | |||
| SCHO / Schwab Strategic Trust - Schwab Short-Term U.S. Treasury ETF | 0.39 | 9.82 | 9.63 | 10.00 | 1.9653 | 0.1103 | |||
| SCHR / Schwab Strategic Trust - Schwab Intermediate-Term U.S. Treasury ETF | 0.37 | 1.96 | 9.29 | 2.65 | 1.8962 | -0.0217 | |||
| JPM / JPMorgan Chase & Co. | 0.03 | 0.00 | 8.20 | 18.19 | 1.6740 | 0.2034 | |||
| MCK / McKesson Corporation | 0.01 | 0.00 | 6.61 | 8.88 | 1.3488 | 0.0626 | |||
| SYK / Stryker Corporation | 0.01 | -1.50 | 5.78 | 4.69 | 1.1795 | 0.0097 | |||
| GOOGL / Alphabet Inc. | 0.02 | -5.87 | 3.44 | 7.28 | 0.7014 | 0.0226 | |||
| CNI / Canadian National Railway Company | 0.03 | 0.00 | 3.44 | 6.74 | 0.7013 | 0.0192 | |||
| CP / Canadian Pacific Kansas City Limited | 0.03 | 0.00 | 2.75 | 12.90 | 0.5612 | 0.0451 | |||
| TMO / Thermo Fisher Scientific Inc. | 0.01 | 0.00 | 2.72 | -18.51 | 0.5554 | -0.1523 | |||
| META / Meta Platforms, Inc. | 0.00 | 0.00 | 2.65 | 28.05 | 0.5415 | 0.1025 | |||
| SLM / SLM Corporation | 0.08 | 0.00 | 2.60 | 11.66 | 0.5298 | 0.0371 | |||
| BRK.B / Berkshire Hathaway Inc. | 0.00 | -0.25 | 2.32 | -9.02 | 0.4738 | -0.0669 | |||
| MCD / McDonald's Corporation | 0.01 | 0.00 | 1.96 | -6.48 | 0.4008 | -0.0441 | |||
| ORCL / Oracle Corporation | 0.00 | 0.00 | 0.91 | 56.60 | 0.1864 | 0.0626 | |||
| AON / Aon plc | 0.00 | 0.00 | 0.76 | -10.64 | 0.1545 | -0.0249 | |||
| BKNG / Booking Holdings Inc. | 0.00 | -22.89 | 0.74 | -3.01 | 0.1513 | -0.0108 | |||
| XLF / The Select Sector SPDR Trust - The Financial Select Sector SPDR Fund | 0.01 | 0.00 | 0.53 | 5.14 | 0.1087 | 0.0014 | |||
| EWBC / East West Bancorp, Inc. | 0.01 | 0.00 | 0.53 | 12.47 | 0.1086 | 0.0084 | |||
| TSM / Taiwan Semiconductor Manufacturing Company Limited - Depositary Receipt (Common Stock) | 0.00 | 0.00 | 0.47 | 36.63 | 0.0961 | 0.0230 | |||
| NFLX / Netflix, Inc. | 0.00 | 0.00 | 0.37 | 43.30 | 0.0765 | 0.0212 | |||
| AXP / American Express Company | 0.00 | 0.00 | 0.34 | 18.60 | 0.0690 | 0.0086 | |||
| WTW / Willis Towers Watson Public Limited Company | 0.00 | 0.00 | 0.32 | -9.22 | 0.0644 | -0.0093 | |||
| PRU / Prudential Financial, Inc. | 0.00 | -99.10 | 0.21 | -99.14 | 0.0436 | -5.1983 | |||
| VTI / Vanguard Index Funds - Vanguard Total Stock Market ETF | 0.00 | -100.00 | 0.00 | 0.0000 | |||||
| NOC / Northrop Grumman Corporation | 0.00 | -100.00 | 0.00 | 0.0000 | |||||
| VCIT / Vanguard Scottsdale Funds - Vanguard Intermediate-Term Corporate Bond ETF | 0.00 | -100.00 | 0.00 | 0.0000 | |||||
| BND / Vanguard Bond Index Funds - Vanguard Total Bond Market ETF | 0.00 | -100.00 | 0.00 | 0.0000 | |||||
| SYY / Sysco Corporation | 0.00 | -100.00 | 0.00 | 0.0000 | |||||
| BX / Blackstone Inc. | 0.00 | -100.00 | 0.00 | 0.0000 |